Litecoin (LTC) Price Prediction: LTC/USDT Price Remains Stagnant Above the $60.00 Mark
Estimated Reading Time: 3 minutes
Don’t invest unless you’re prepared to lose all the money you invest. This is a high-risk investment and you are unlikely to be protected if something goes wrong. Take 2 minutes to learn more

Litecoin (LTC) Price Prediction: September 17
The Litecoin market remains largely depressed as its price action continues to hover close to the $60.00 baseline. Furthermore, price activity remains below key technical landmarks, which limits bullish hopes. However, the market may progress quickly if favorable fundamentals emerge.
LTC/USDT Long-term Trend: Bullish (Daily Chart)
Key Price Levels:
Resistance: $65.00, $70.00, $75.00
Support: $60.00, $55.00, $50.00
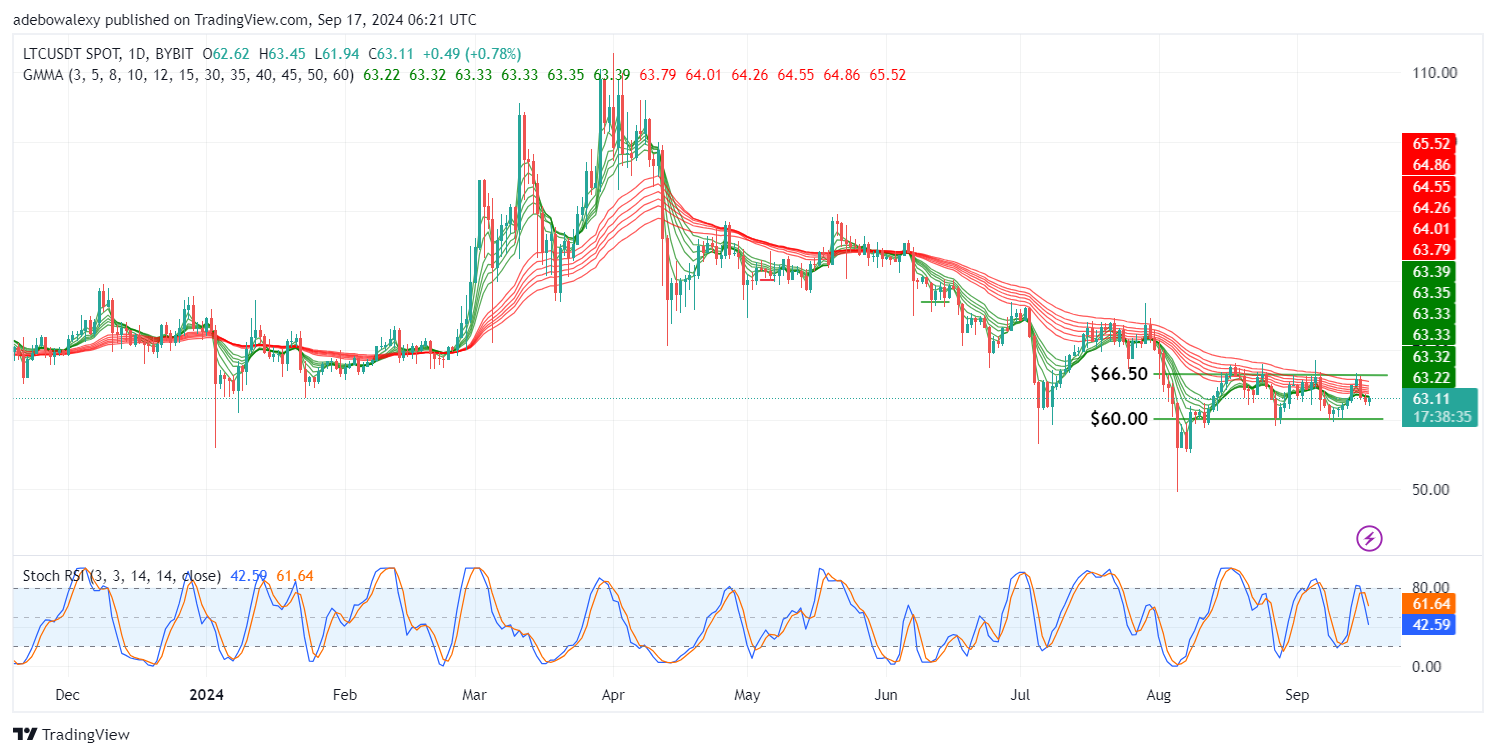
Price movement on Litecoin’s daily chart since the previous session has been hovering around the Guppy Multiple Moving Average (GMMA) curves. In addition, the ongoing session has brought some minor upside retracement to the market. As a result, the market is now testing the GMMA curves as resistance. At the same time, the Stochastic Relative Strength Index (Stochastic RSI) lines are still dropping toward the 50 mark on the indicator.
Litecoin (LTC) Price Prediction: Will the LTC/USDT Upside Retracement Survive?
On the LTC/USDT price chart, the market has started appearing below all the GMMA indicator lines, a trend that began in the previous session. However, the ongoing session has rebounded positively but still places the market below the GMMA lines. This hints at the possibility of downward forces erasing the minor rebound.
Additionally, the Stochastic RSI indicator lines are still descending despite the minimal upside rebound. Therefore, it seems likely that downward forces are in charge. However, this is subject to change if bullish forces gain enough strength to push through the green set of GMMA lines.
Litecoin (LTC) Price Prediction: LTC/USDT May Have Started Taking the Right Steps (4-Hour Chart)
The Litecoin 4-hour market seems to indicate that bullish forces may have started mounting pressure. The last three price candles appear elevated as they rise through the GMMA lines. The last price candle is red but shows very little downward retracement.
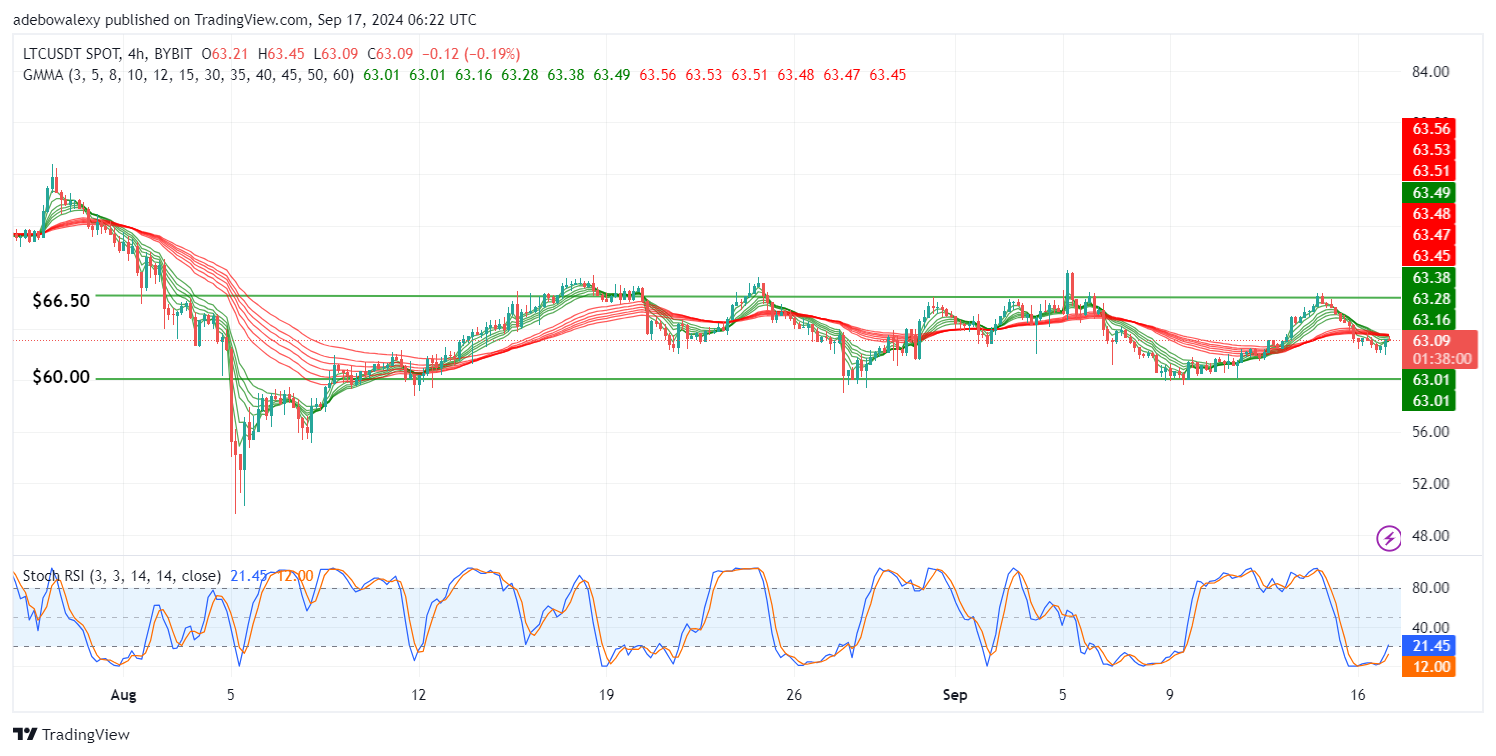
Meanwhile, the Stochastic RSI lines are still rising despite the deflection, suggesting that traders can anticipate a short-term upside move in this market. However, to be on the safer side, traders can wait until the price hits the $63.45 threshold before aiming for the $65.00 mark.