Dogecoin (DOGE) Price Prediction: DOGE/USDT Continues to Hover Above the $0.1000 Price Level
Estimated Reading Time: 3 minutes
Don’t invest unless you’re prepared to lose all the money you invest. This is a high-risk investment and you are unlikely to be protected if something goes wrong. Take 2 minutes to learn more

Dogecoin (DOGE) Price Prediction: September 16
For some time now, the Dogecoin market has been oscillating between the price range of $0.1086 and $0.09440. Currently, the coin trades above the $0.1000 threshold. However, the market has the potential to break below this baseline, according to current indicators.
DOGE/USDT Long-term Trend: Bullish (Daily Chart)
Key Price Levels:
Resistance: $0.4500, $0.5000, $0.5500
Support: $0.4000, $0.3500, $0.3000
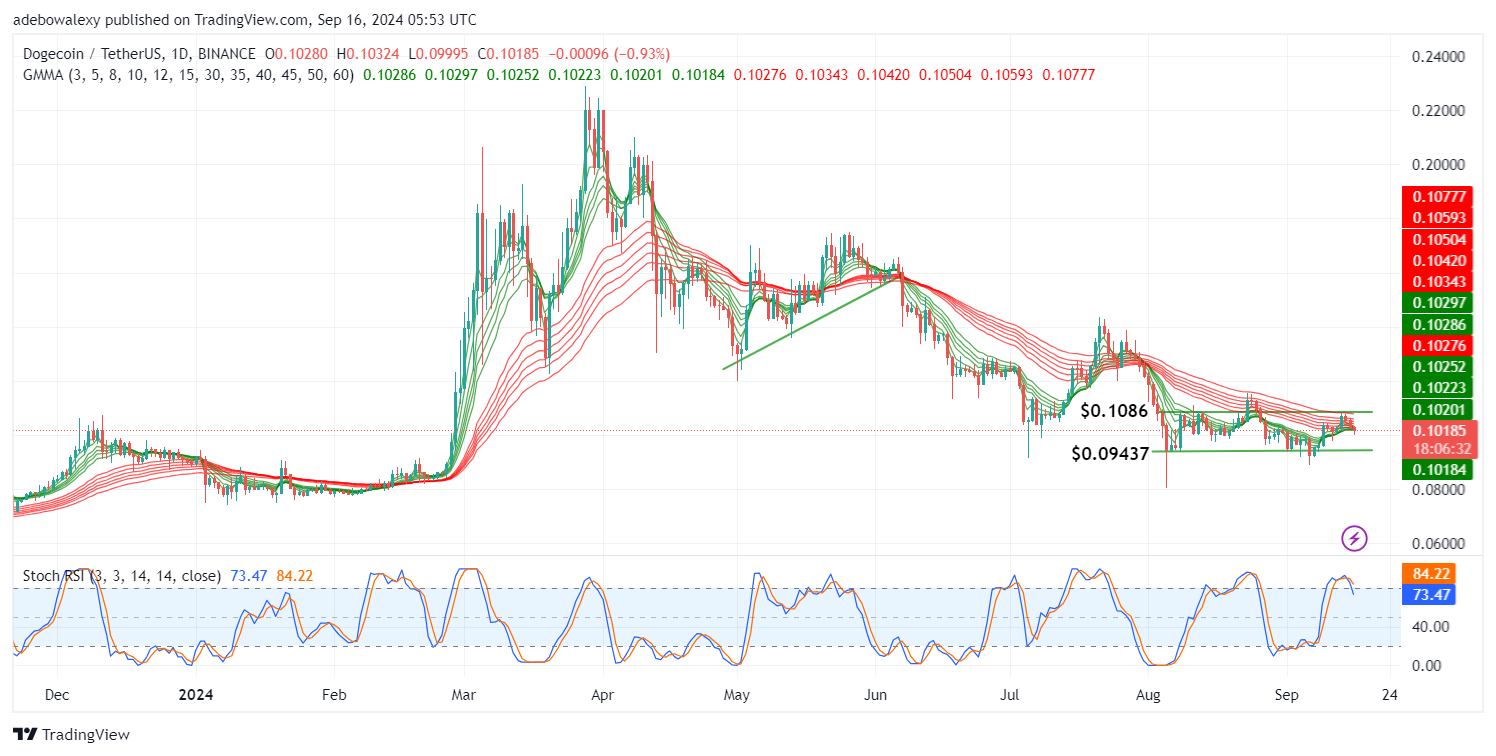
Price action in the DOGE/USDT daily market earlier tested the resistance at the $0.1086 threshold. The tested resistance led to a rejection, and price action could not break this level. This resulted in a downward retracement through the Guppy Multiple Moving Average (GMMA) lines. The ongoing session has placed the coin’s price below all the GMMA lines. Meanwhile, the Stochastic Relative Strength Index (Stochastic RSI) lines are now heading downward toward the 80 mark of the indicator.
Dogecoin (DOGE) Price Prediction: DOGE/USDT
At this point, Dogecoin trades within the drawn price channel, with $0.1086 as resistance and $0.09440 as support. Given the coin’s price position below all the GMMA lines, it seems likely that the market may proceed downward.
Additionally, the GMMA lines are crossing each other above the current price level. The trajectory of the Stochastic RSI lines also doesn’t suggest resistance to the short-term downward trend. Therefore, price action may continue to decline toward the support level of this price channel, barring any contrary catalyst.
Dogecoin (DOGE) Price Prediction: DOGE/USDT Market Presents Weak Resistance (4-Hour Chart)
Price activity in the Dogecoin market maintains some consistency, as price action remains below the GMMA lines. Meanwhile, the 4-hour chart shows that a green price candle has appeared in the current session, although it remains below all the GMMA lines.
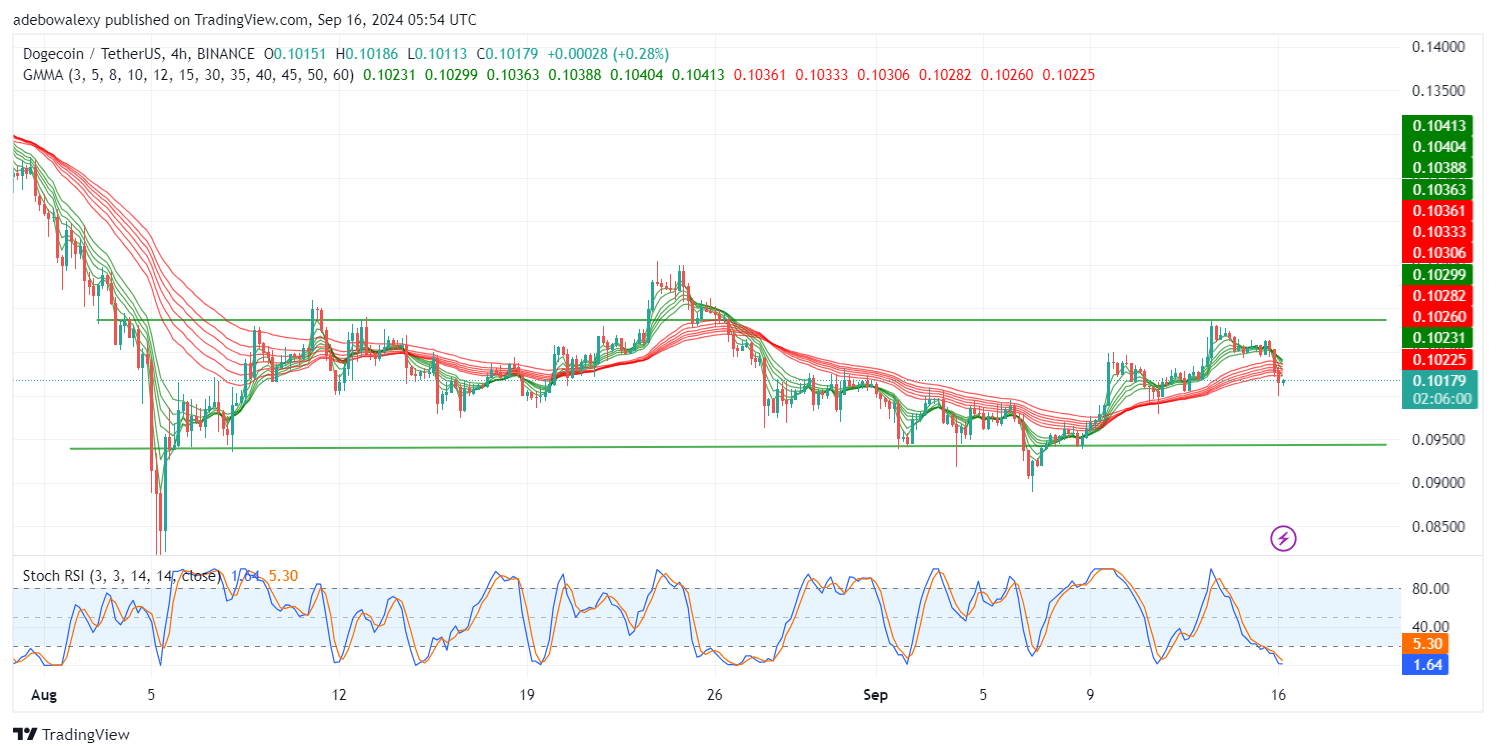
Moreover, the Stochastic RSI lines have descended into the oversold region, with the leading line seemingly ready to remain there. The size of the last price candle indicates that the minimal rebound is weak and overwhelmed. Technically, it seems more likely that price action will descend further toward the support level at the $0.09440 mark.