Universal Market Access (UMA/USD) Breaks Out: A New Higher Support Level Confirmed?
Estimated Reading Time: 3 minutes
Don’t invest unless you’re prepared to lose all the money you invest. This is a high-risk investment and you are unlikely to be protected if something goes wrong. Take 2 minutes to learn more

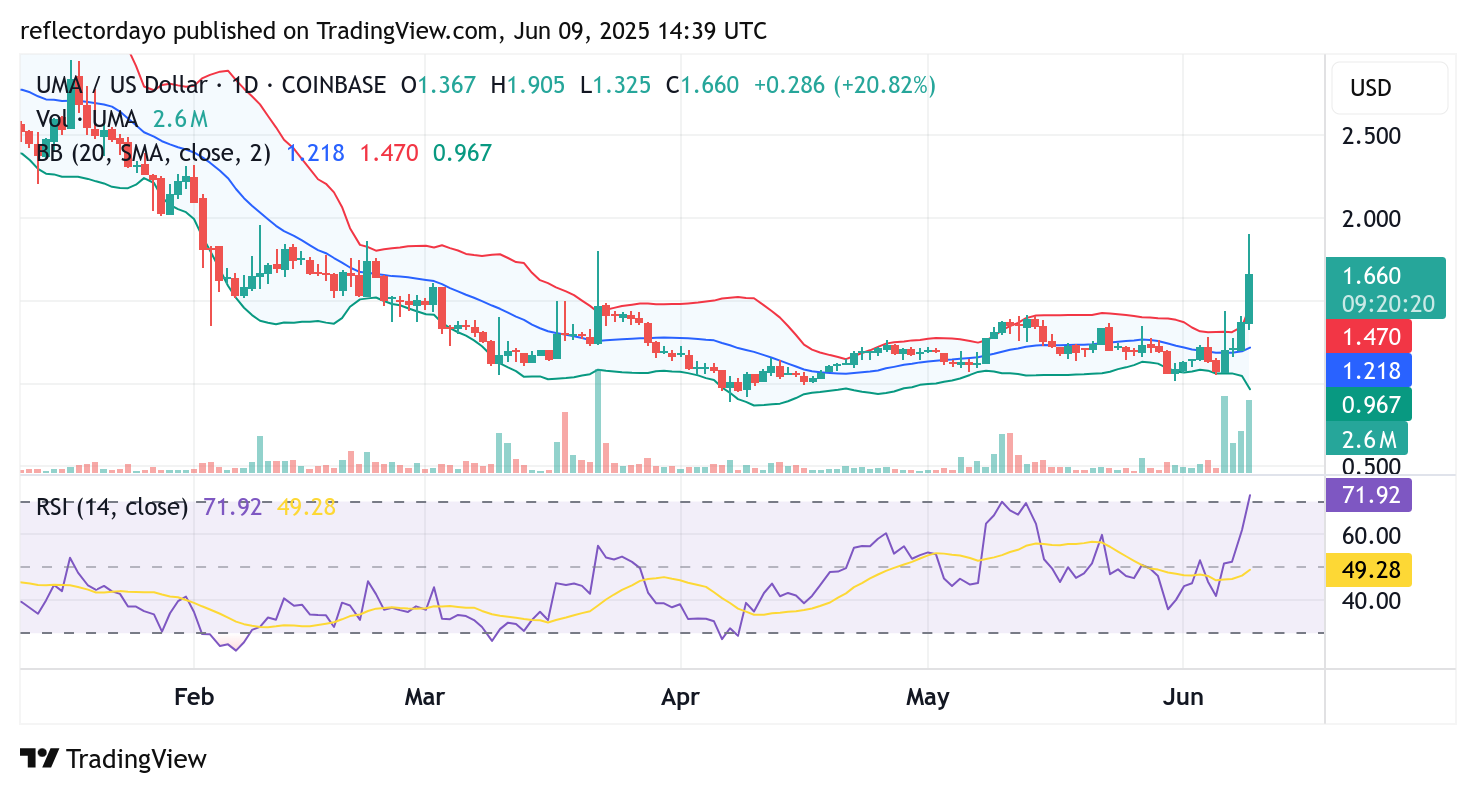
In today’s session, Universal Market Access (UMA/USD) broke out of its recent consolidation around the $1.20 level, propelled by strong bullish momentum. This surge drove the price beyond the $1.50 mark, signaling renewed investor interest.
Earlier in the current bullish run, UMA extended its gains toward the $2.00 threshold. However, significant resistance has once again emerged near the $1.80 level—a zone that previously rejected price advances in late March. The repeated failure to clear this level reinforces its role as a critical resistance point in the current market structure.
If buyers manage to hold above the newly established support around $1.50, this could set the stage for another attempt at a breakout beyond $1.80. A successful breach may open the door for further upside toward the $2.00 psychological barrier.
Universal Market Access Metrics
- UMA/USD Price Now: $1.67
- UMA/USD Market Cap: $143.8 million
- UMA/USD Circulating Supply: 87.5 million UMA
- UMA/USD Total Supply: 124.9 million UMA
- UMA/USD CoinMarketCap Ranking: #277
Key Levels
- Resistance: $1.80, $2.00, and $2.50
- Support: $1.50, $1.20 and $1.00
Universal Market Access (UMA/USD) Shows Strong Bullish Momentum, But Caution Near Resistance Is Warranted
Recent candlestick formations in Universal Market Access (UMA/USD) reflect significant buying activity, highlighting strong bullish sentiment in today’s trading session. However, as price approaches a previously tested high or major resistance level, the possibility of a corrective pullback becomes increasingly likely.
Despite this, the underlying momentum appears strong enough to potentially sustain the current upward movement. Notably, the past four trading days have shown elevated histogram bars on the volume indicator, signaling strong participation and a clear buying bias over selling pressure. This suggests that a bullish trend may be solidifying.
Should a short-term correction or profit-taking phase occur, the $1.50 level is likely to serve as the next key re-entry point. This price level has now emerged as a higher support zone, offering a potential foundation for continued upward movement.

UMA/USD 4-Hour Chart: Price Stabilizes at $1.65 as Market Awaits Directional Breakout
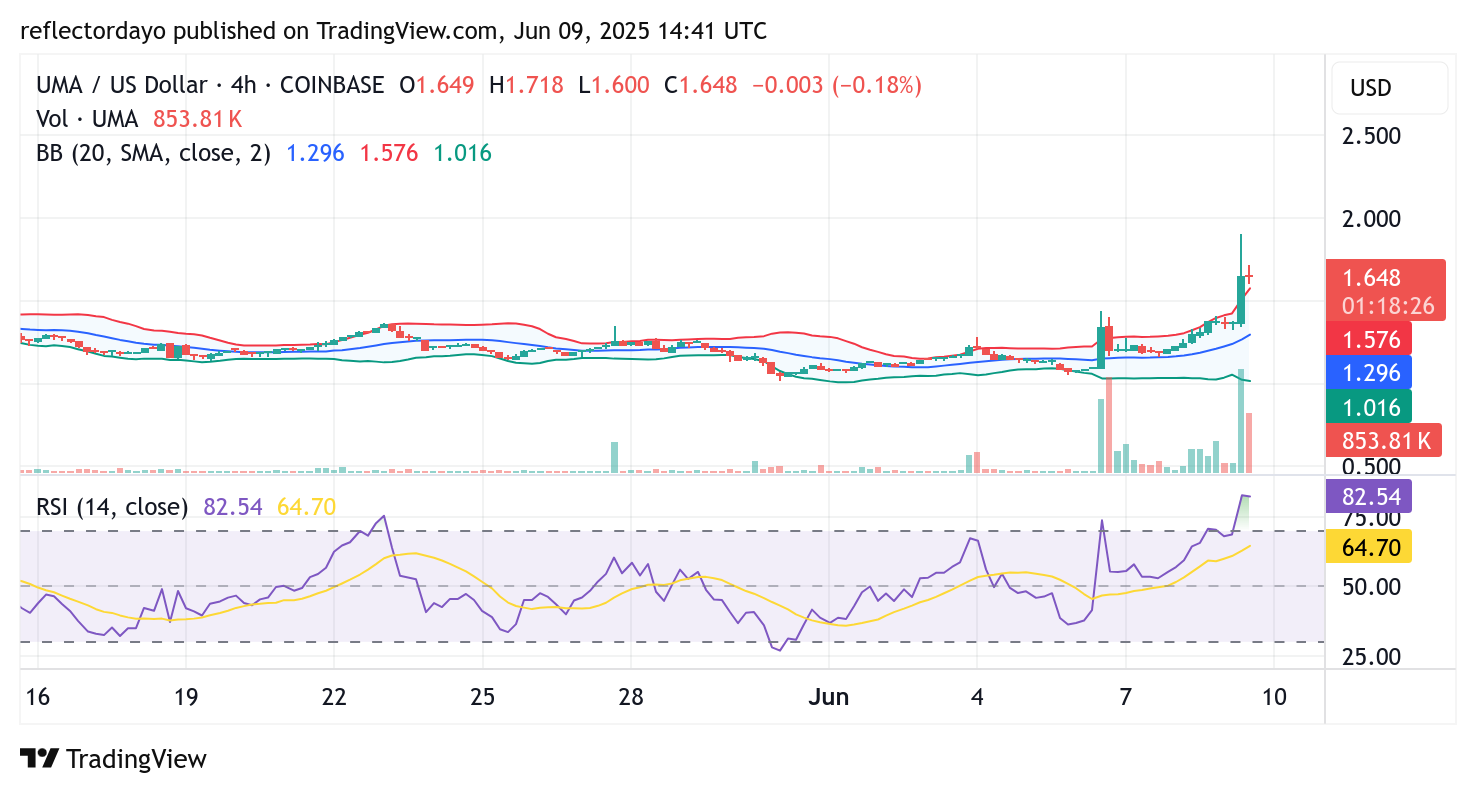
The 4-hour chart for Universal Market Access (UMA/USD) reveals signs of an overbought condition, driven by recent demand surges. This is confirmed by technical indicators showing stretched buying momentum, as well as heightened volume histogram activity.
Currently, the market appears to be in a standoff, with both buyers and sellers vying for control near the $1.65 level. This tug-of-war has created a temporary pause in bullish momentum, suggesting the possibility of either a consolidation phase or a short-term correction.
If buyers fail to sustain control at $1.65, the $1.50 level is expected to serve as the next critical support zone. A successful hold at this level could reinforce bullish structure and provide a platform for the next potential upward move.