Top Trending Coins for Today, July 9: PEPE, BTC, SOL, XVG, and ETH
Estimated Reading Time: 5 minutes
Don’t invest unless you’re prepared to lose all the money you invest. This is a high-risk investment and you are unlikely to be protected if something goes wrong. Take 2 minutes to learn more
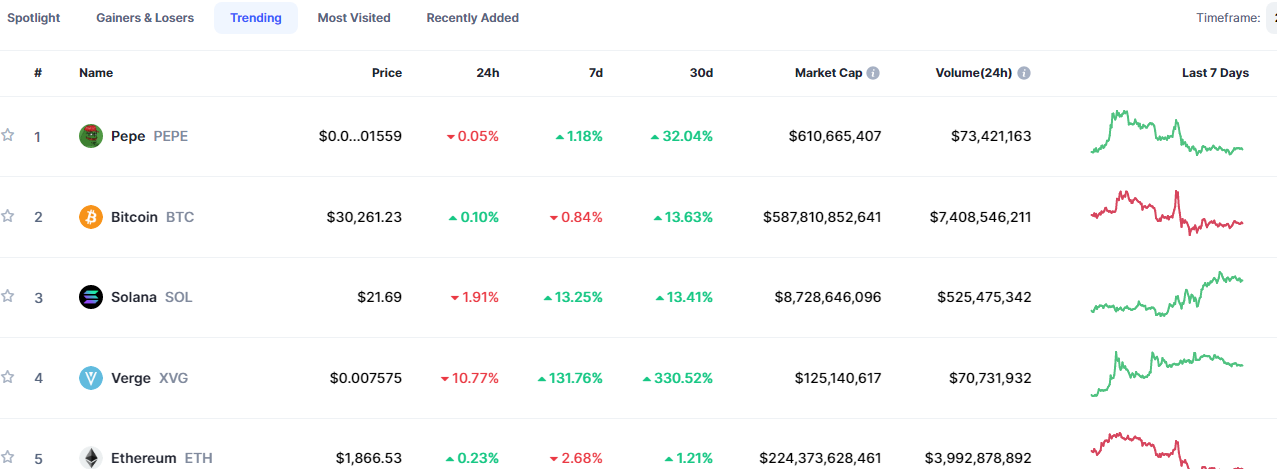
On this week’s top 5 trending coins, we noticed the re-emergence of some famous coins on the list. Some of these markets were able to make the list within the space of 24 hours. In the course of the week, some of these markets have seen strong volatility, and this alone seems to have given them a place on the list even though they sustained significant losses during the week.
Pepe (PEPE)
Major Bias: Indecision
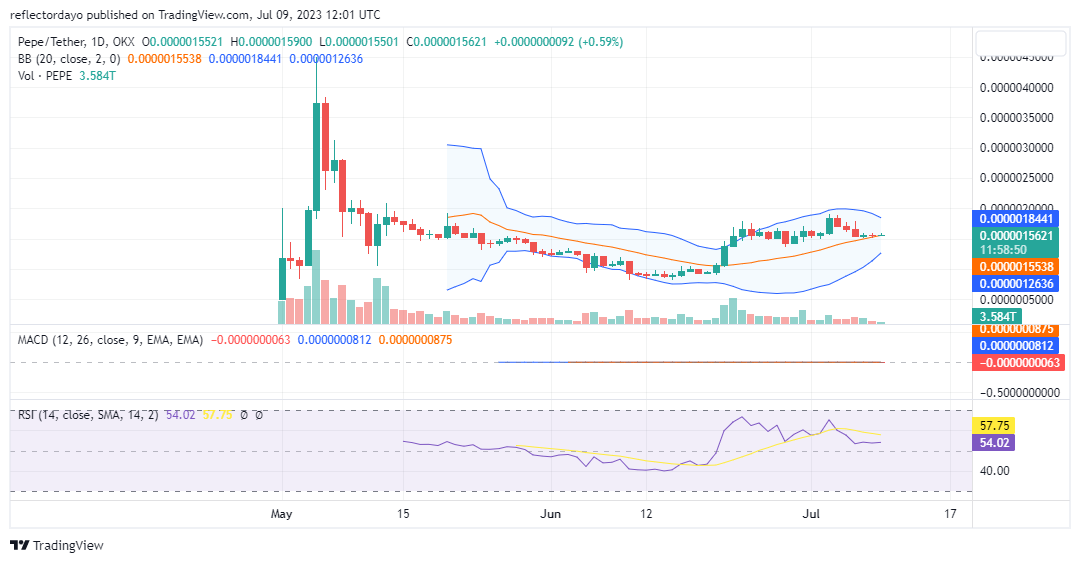
The PEPE market continues to hold the number one position on the list. However, its performance during the last week hasn’t been particularly strong. During the previous week, it increased by roughly 1.18%, and over the last day, it decreased by 0.05%. By settling near the $0.0000015759 price level, the market has been able to maintain its leading position. By just maintaining the price constant at the same level for more than two weeks, PEPECOIN has maintained its top spot this week.
In the Relative Strength Index, the market’s momentum has remained at level 54 since July 6. This flat market is what ended the bear market that was triggered at the high of $0.0000019058. The market is about to see another price breakout because of the convergence of the Bollinger bands. A clear price breakout will follow this volatility squeeze.
Current Price: $0.00000156
Market Capitalization: $610,665,407
Trading Volume: $73,421,163
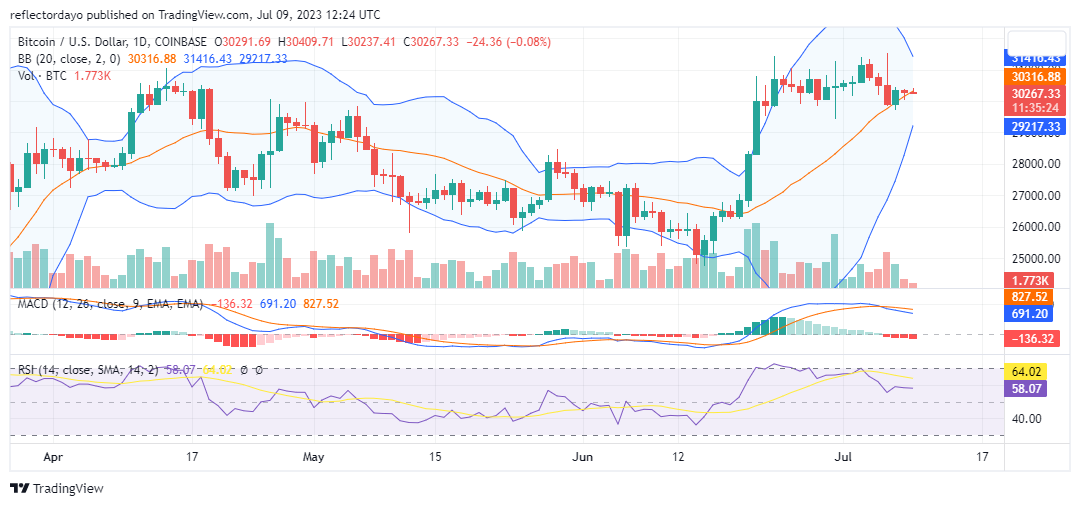
Bitcoin (BTC)
Major Bias: Indecision
Over the past two weeks, the Bitcoin market has exhibited erratic oscillations around the $30,415 price level, indicating a horizontal sideways movement. In terms of technical indicators, one useful tool for analyzing market volatility is the Bollinger Bands indicator.
In the Bollinger Bands indicator, the distance between the upper standard deviation curve and the lower standard deviation curve is a measure of the level of volatility in the market. For the past 2 weeks, the market has oscillated erratically, but currently, the curves are converging as indecision in the market reaches its peak. With the volatility squeeze, a strong price breakout is imminent.
Bitcoin made around 84% losses during the week, but in the past 24 hours it has recovered by just 0.10%. We can say that what earned Bitcoin the second position on this week’s list was that the market maintained about the same price for the past two weeks despite the level of volatility. With the price consolidation at the current level, either strong support or strong resistance is going to form at this level after the price breakout.
Current Price: $30,5261.23
Market Capitalization: $587,810,852,641
Trading Volume: $7,408,546,211
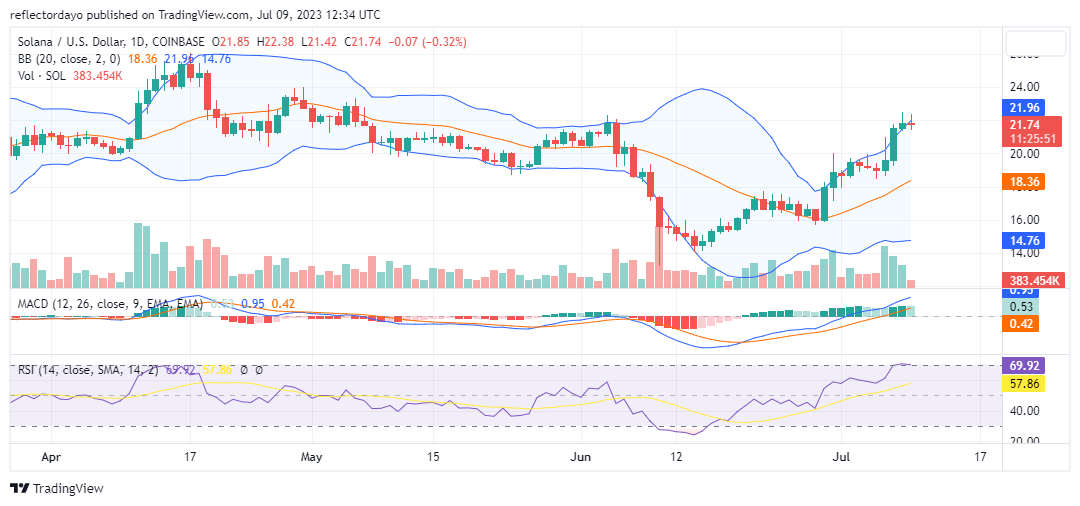
Solana (SOL)
Major Bias: Bullish
Looking at this market, it is clearly in an uptrend. It has been having higher lows and higher highs since the middle of June. Each time it encountered resistance, it appeared as an opportunity for new investors to join the upward-bound market. More investors are willing to buy than to sell.
The Bollinger Bands indicator, even though its wide bands signify a high level of volatility, is now illustrating an upward bound price channel. The main bias in the market is bullish. However, in the past 24 hours, the market has suffered a 1.91% loss. This is because it had encountered a major resistance level.
Current Price: $21.69
Market Capitalization: $8,728,646,019
Trading Volume: $525,475,342
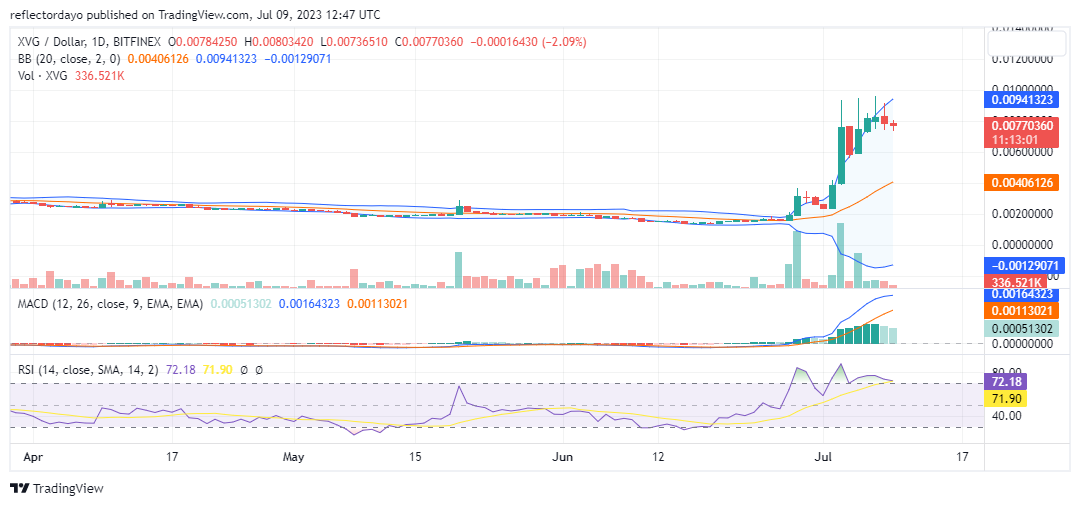
Verge (XVG)
Major Bias: Bullish
The Verge market (XVG/USD) has shown significant price movements over the past week. As of the current price of $0.007575, it has gained approximately 131% in the past seven days. However, in the last 24 hours, the market has experienced a loss of 11%. To gain a deeper understanding of the market, let’s examine the daily chart.
For a considerable period, the Verge market was confined within a narrow horizontal price channel around the $0.0016 level. This sideways movement indicates a lack of clear direction or market indecision during that time. However, a significant bullish price breakout occurred on June 28th, leading to a substantial upward movement.
Considering the recent gain of 131% over the past seven days, it appears that the Verge market experienced a strong bullish rally. Such substantial gains often attract profit-taking by traders, leading to short-term price corrections or pullbacks. The 11% loss in the last 24 hours could be a result of profit-taking or a temporary price retracement.
Current Price: $0.007575
Market Capitalization: $125,140,617
Trading Volume: $70,731,932
Ethereum (ETH)
Major Bias: Indecision
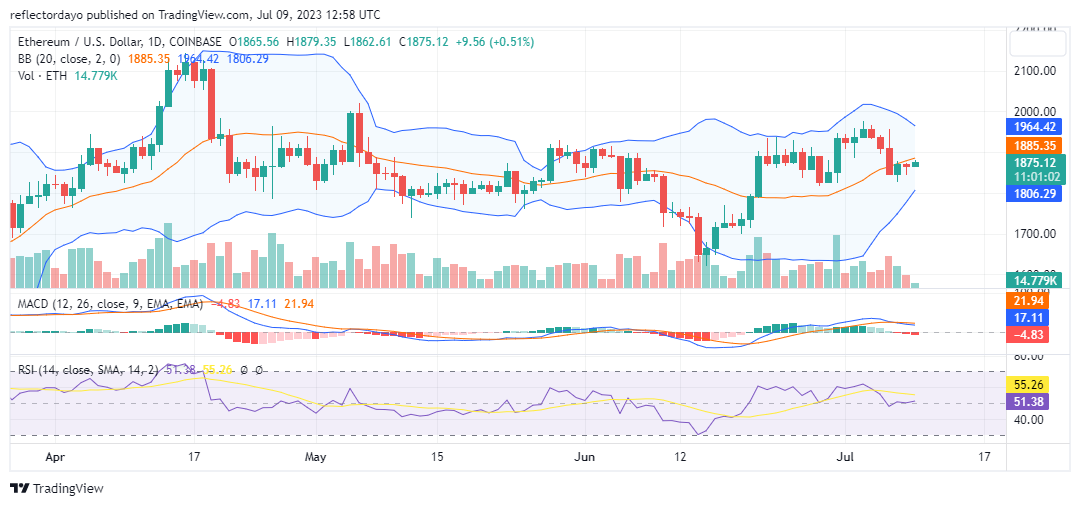
The Ethereum market peaked around the $1973 price level on July 3, and a bear market was triggered from that level. The $1973 price level appears to be the take-profit area, and when the market attempted to near this level on July 6, the bear market drove the price further into the demand zone. Ethereum was able to find solid ground at $1843.74, but the bullish price recovery has not been able to come up above the 20-day moving average. According to the Relative Strength Index (RSI), the market is at equilibrium.
Current Price: $1806
Market Capitalization: $224,373,628,461
Trading Volume: $3,992,878,892