Cardano (ADA/USDT) Shows Strong Rebound as Bulls Challenge Key Resistance Zones
Estimated Reading Time: 3 minutes
Don’t invest unless you’re prepared to lose all the money you invest. This is a high-risk investment and you are unlikely to be protected if something goes wrong. Take 2 minutes to learn more
ADA/USDT Long-term Analysis: Bullish
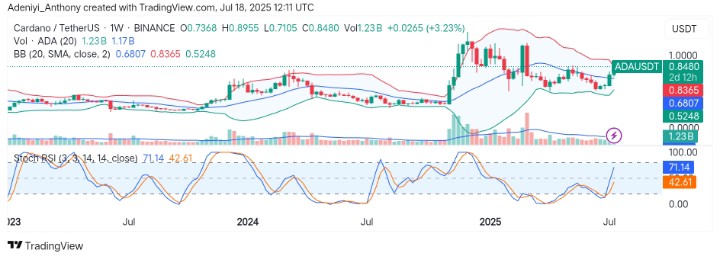
The analysis of Cardano against the Tether is showing fresh signs of strength on the weekly timeframe, after months of sideways movement and fading momentum. However, the bulls have stepped back in with decent volume support. This recent rally has pushed the pair above the upper Bollinger Band, signaling that a potential upside could be underway as the market gradually shifts from neutral to bullish, breaking out of its consolidation range.
Currently, Cardano trades at $0.8480, projecting a price of $1.000 with over 1 billion in traded volumes for the week.
Technical Indicators
Major Resistance Levels: $0.9000, $1.0000, and $1.1000
Major Support Levels: $0.8365, $0.6807, and $0.5248
ADA/USDT Technical Analysis
The analysis of Cardano against the Tether on the weekly timeframe shows that the price has formed a bullish engulfing candle, closing strongly above last week’s high. This confirms demand returning at lower levels. From another angle, the volume is also increasing as the price keeps pushing above the upper limit of the Bollinger Bands.
On the other hand, the Stochastic RSI is displaying an early bullish momentum, which is confirming a short-term upside on the horizon. To this end, if the current momentum is preserved, a move above $0.8500 would guarantee further trajectory towards $1.000 in the coming session.
ADA/USDT Analysis: What’s Next?
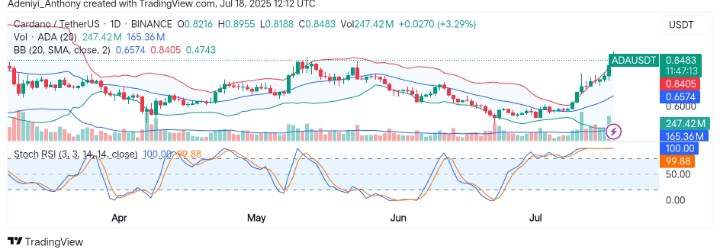
On the daily chart, ADA/USDT is displaying a short-term bullish momentum, with the price also breaking above the upper Bollinger Band. However, the pair appears to have posted several consecutive bullish candles, showing sustained buyer interest and momentum build-up.
From another angle, the volume appears to be rising alongside price, adding credibility to the breakout, as the Stochastic RSI overbought zone suggests the market may be due for a minor pullback.
To this end, a close above $0.9000 would indicate continued upside, while $0.7600 could act as a pullback option for a good entry opportunity.
You can purchase crypto coins here. Buy LBlock