Wall Street Memes (WSM) Price Is Hovering, Positions Are Piling In
Estimated Reading Time: 3 minutes
Don’t invest unless you’re prepared to lose all the money you invest. This is a high-risk investment and you are unlikely to be protected if something goes wrong. Take 2 minutes to learn more

Wall Street Memes Price Prediction – November 25
WSM’s price action remains stable, holding a steady range as recent buying interest gradually increases. Market participants appear to be adding exposure at supportive levels, keeping momentum steady and signaling a growing buildup of trading positions.
WSM/USD’s price continues to hold within a steady range, reflecting a calm and balanced market environment that limits excessive volatility. At the same time, gradual increases in buying interest suggest improving sentiment, as more participants show willingness to engage at supportive zones, contributing to a slow but noticeable buildup in overall trading positions.
WSM/USD Market
Key Levels
Resistance levels: $0.00035, $0.0004, $0.00045
Support levels: $0.00025, $0.0002, $0.00015
WSM/USD – 4-hour Chart
On the medium-term chart, the WSM/USD trade’s activity has appeared to be hovering around $0.0003, making positions pile in.
The Bollinger Bands have been firmly positioned, clearly showing $0.00035 as the main short-term barrier zone for price movement. The Stochastic Oscillators have consistently kept to a northbound-swerving mode, signaling that purchasers are steadily on the pattern of increasing buying muscles and overall market confidence.
Can Wall Street Memes (WSM) Maintain Its Hovering Price as Increasing Market Positions Continue Building Up?
The WSM/USD trade may keep its price steady if underlying support levels continue to hold, while growing market participation helps maintain stability. However, its short-term direction will still depend on momentum strength and how buyers and sellers react around key chart zones.
WSM’s ability to maintain a steady price range against the USD will largely depend on how firmly its support zones continue to hold during shifting market activity. At the same time, the gradual increase in participation could help stabilize short-term movement, provided momentum remains balanced between buyers and sellers.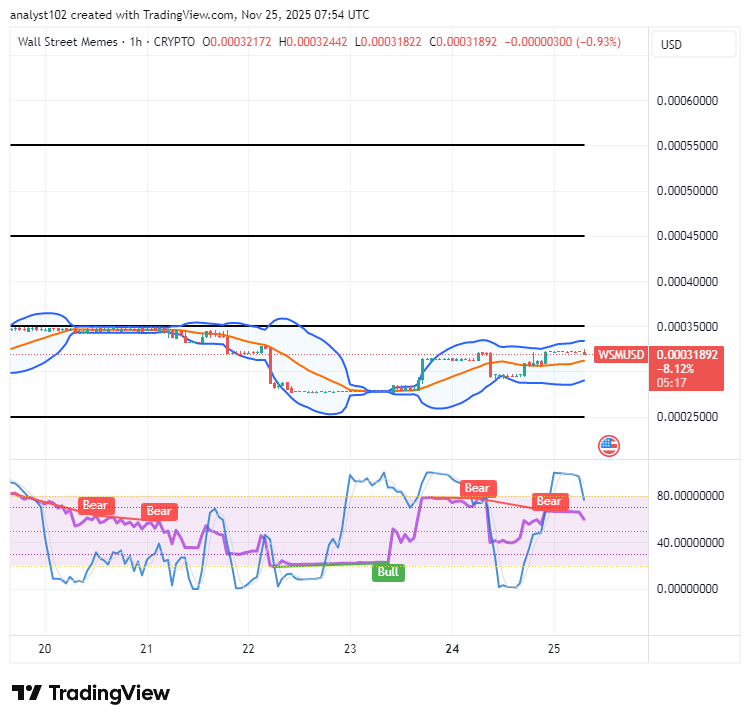
WSM/USD 1-hour chart
The WSM/USD short-term chart showcases the base-crypto trade hovering around $0.0003 values, as buyers are taking positions ahead of a probable massive rebound afterward.
According to the latest analysis, the Stochastic Oscillators show only slight bearish signals, appearing cautiously in the market. Meanwhile, the Bollinger Bands have remained tactically northward, holding a stable and firm lower base spot with added resilience.
Over the past 24 hours, the $WSM token ecosystem and its broader community experienced a coordinated, high-level attack, with malicious actors specifically targeting our Discord infrastructure to disrupt operations and undermine community stability.
Over the last 24 hours, The $WSM token and community has undergone a coordinated attack. The hackers specifically targeted our Discord community.
— Wall Street Memes (@wallstmemes) October 12, 2023
We reiterate that no one from the Wall St Memes team will ever direct message you first, or ask for any personal information – even… pic.twitter.com/VwySpXC7cz