Bitcoin (BTC/USD) Price Declines, Sitting on $45,000
Estimated Reading Time: 3 minutes
Don’t invest unless you’re prepared to lose all the money you invest. This is a high-risk investment and you are unlikely to be protected if something goes wrong. Take 2 minutes to learn more

Free Crypto Signals Channel
Bitcoin Price Prediction – April 6
The BTC/USD market financial book of records has the crypto-economic price declines to find a sit on the $45,000 trading line. The crypto-economic valuation now trades around $45,399 with a high and low of $45,554 and $44,482 at a minimal negative percentage of 0.31.
BTC/USD Market
Key Levels:
Resistance levels: $47,500, $50,000, $52,500
Support levels: $42,500, $40,000, $40,000
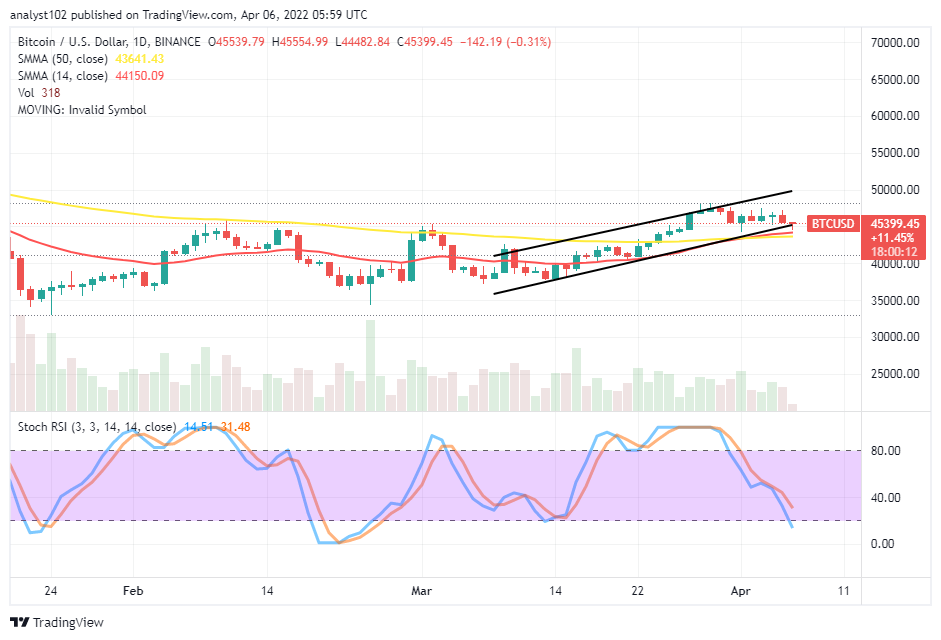
BTC/USD – Daily Chart
The BTC/USD daily chart shows the crypto-economic price declines, sitting on the $45,000 trading level. The 14-day SMA indicator has slightly moved above the 50-day SMA indicator. And they are underneath the current trading spot. The bullish channels’ trend lines drew northward to keep the pace of the price actions. The Stochastic Oscillators are downward-positioned, trying to penetrate the oversold region around the 20 range.
As the BTC/USD market price declines, sitting on the $45,000 level, can there still be more downs afterward?
There can be more downs in the BTC/USD market operations as the crypto-economic price declines to sit around $45,000. In the wake of lacking a healthy rebounding force around the value-line, the price will go down in any format to let in another round of finding an ideal support trading ground. Bulls, at this point, should be cautious of exerting a new order.
On the downside of the technical analysis, the BTC/USD market bears needed to add more pressure on the current declining nature of the crypto-economic trading condition by making sure that the price isn’t allowed to push back northward to the extent of breaking past the $47,500 resistance. A break past the trading line may summarily lead to trading at a spot higher than the last resistance trading zone. A sustainable breakdown of the market at the $45,000 level will play a role in portending a trait of downward-trending motion returning.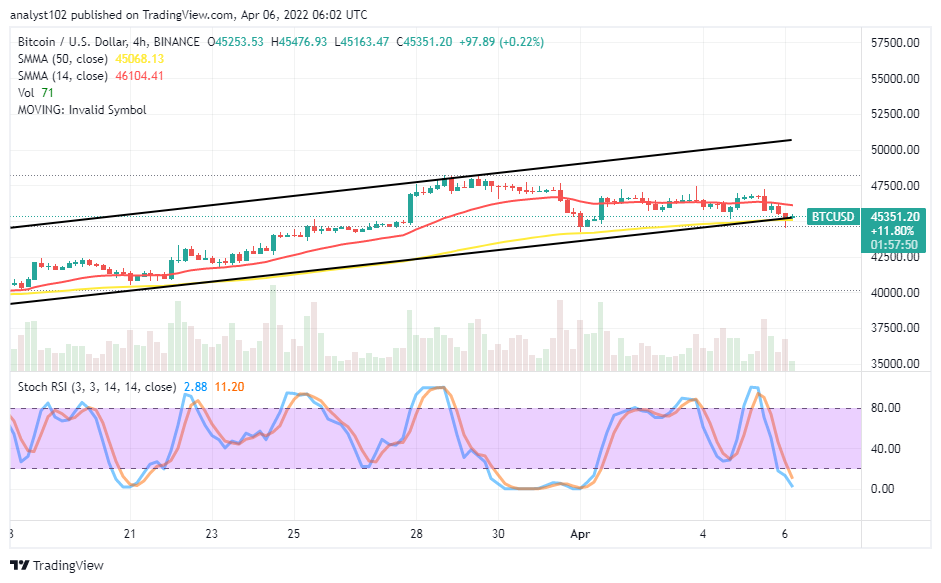
BTC/USD 4-hour Chart
The BTC/USD 4-hour chart showcases the crypto-economic market price declines, sitting around the $45,000 trading level. The lower bullish channel trend line drew closely alongside the 50-day SMA indicator underneath the 14-day SMA indicator. The Stochastic Oscillators have moved into the oversold region, pointing toward the southbound to indicate that a downing force is ongoing. The current trade pattern settings show that analytics emphasis should be placed on the $47,500 resistance putting the market back into a trading situation that invalidates bears’ trading strength in the market operations afterward.
Note: Cryptosignals.org is not a financial advisor. Do your research before investing your funds in any financial asset or presented product or event. We are not responsible for your investing results.
You can purchase Lucky Block here. Buy LBlock: