Solana (SOL/USD) Price Remains Caged in Range-Bound Spots
Estimated Reading Time: 3 minutes
Don’t invest unless you’re prepared to lose all the money you invest. This is a high-risk investment and you are unlikely to be protected if something goes wrong. Take 2 minutes to learn more

Free Crypto Signals Channel
Solana Price Prediction – August 12
The SOL/USD market trading outlook yet depicts the crypto economy remains caged in range-bound spots. Price worth, as of the time of writing, trades around $43 at a percentage rate of 1.07 positive.
SOL/USD Market
Key Levels:
Resistance levels: $50, $60, $70
Support levels: $25, $20, $15
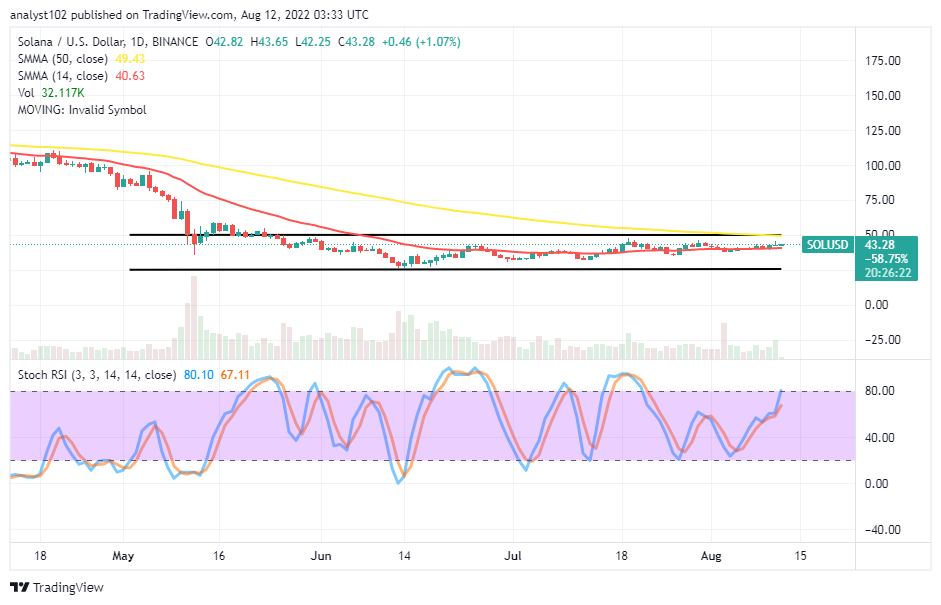
SOL/USD – Daily Chart
The SOL/USD daily chart reveals the crypto market remains caged in range-bound spots of $25 and $50. The usual range value lines have been over several trading sessions. The upper horizontal range line drew at $50, and its lower part is at $25, embodying the smaller SMA trend line. The 50-day SMA indicator is precisely at $49.43 above the $40.63 value point of the 14-day SMA indicator. The Stochastic Oscillators have positioned northbound from the range at 20 to the 80 range, feebly pointing to the upside to denote that a little buying moment is still somewhat on.
Will the SOL/USD market keep moving in ranges until subsequent sessions?
It’s most likely that the SOL/USD market to keep to its current style of moving until the coming several sessions as the crypto price remains caged in range-bound spots. Currently, the crypto economy is heading to the verge of completing an upward force around the $50 upper range trading zone in the near time. That is a warning signal against the possibility of observing sustainable upward motions over that point.
On the downside of the technical analysis, the time for price reversal-moving pattern seems to be slow in approach below the markup point around the resistance of the $50 range line. Nevertheless, it will potentially come to the past when least expected. Therefore, short-position players may have to use either a 1-hour chart or a 4-hour chart to observe an ideal moment to go for re-launching of selling order afterward.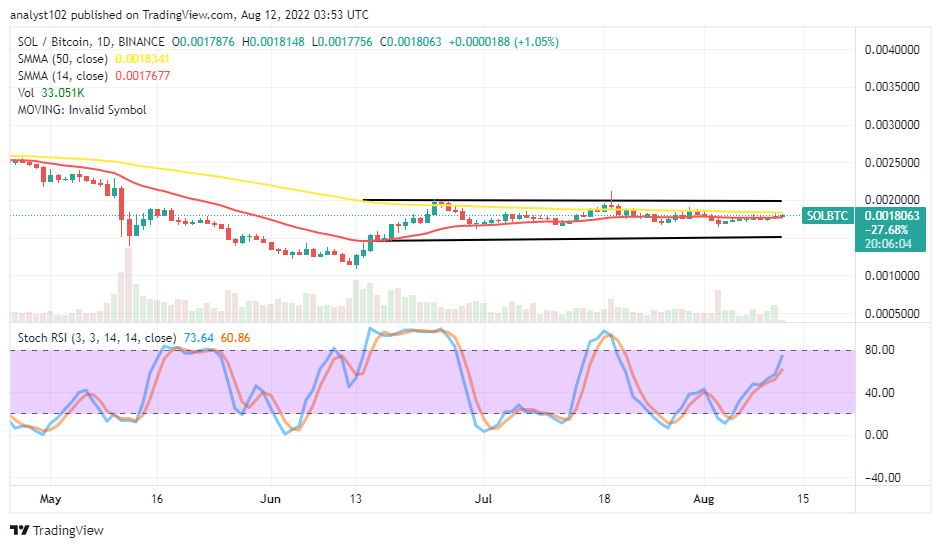
SOL/BTC Price Analysis
Solana is pushing sideways against the trending ability of Bitcoin at relatively higher-resistance trading spots, bordering around the trend lines of the SMAs. The cryptocurrency pair price remains caged in range-bound zones. The 14-day SMA indicator is closely underneath the 50-day SMA indicator. The Stochastic Oscillators have struggled to swerve northbound from the 20 range toward the 80 range. The base crypto may run a false move against its counter crypto while the price tends to touch the upper range line.
Note: Cryptosignals.org is not a financial advisor. Do your research before investing your funds in any financial asset or presented product or event. We are not responsible for your investing results.
You can purchase Lucky Block here. Buy LBLOCK