SPONGE/USD ($SPONGE) Consolidation Sets Stage for Possible Breakout
Estimated Reading Time: 2 minutes
Don’t invest unless you’re prepared to lose all the money you invest. This is a high-risk investment and you are unlikely to be protected if something goes wrong. Take 2 minutes to learn more

The $SPONGE market continues to hover around the $0.000078 price zone, with the 20-day moving average drifting downward and drawing closer to the sideways consolidation. This convergence between a sloping average and horizontal price action often signals that the market is preparing for a strong directional move.
In this setup, the conditions hint that a rebound could be forming. If bullish momentum builds, the $0.0001 resistance zone stands as the next critical upside target.
Key Price Levels
-
Resistance: $0.000115, $0.000120, $0.000130
-
Support: $0.000075, $0.000070, $0.000065
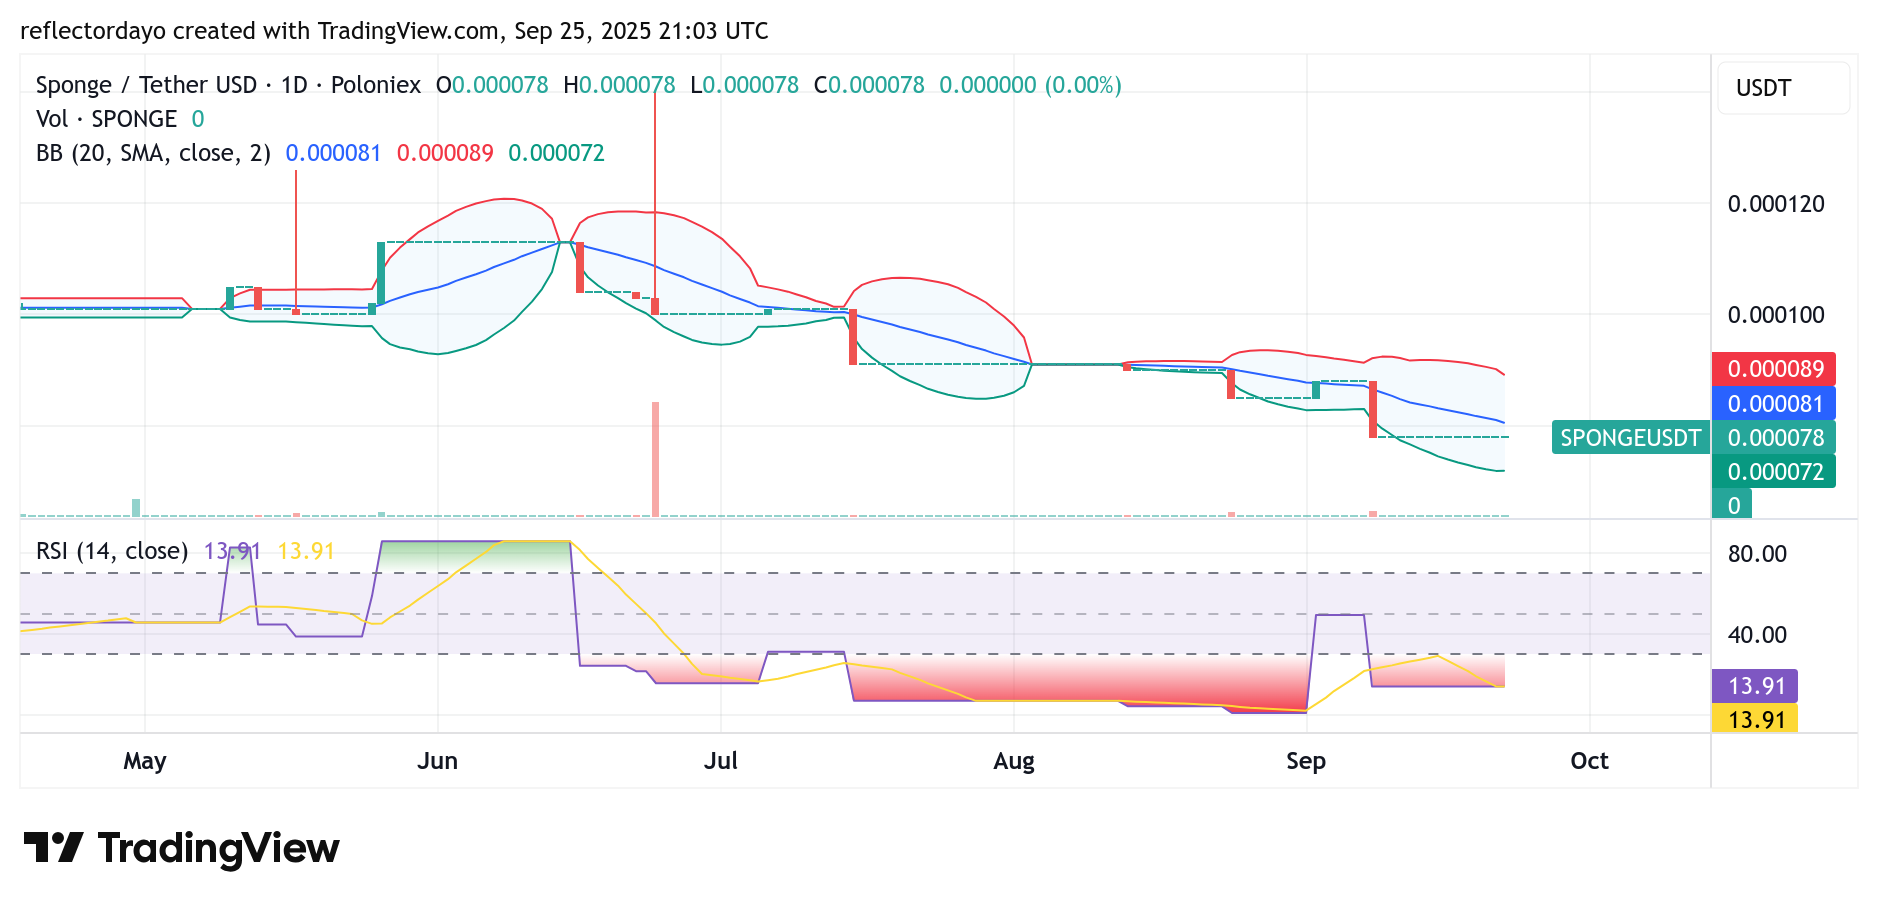
SPONGE/USD Daily Chart Perspective: Oversold Market Draws Attention
From a technical standpoint, $SPONGE shows signs of being primed for recovery. The price remains anchored near $0.000078, while the Relative Strength Index (RSI) lingers at an extreme 13.9 reading, signaling heavy oversold conditions. With limited room for further downside and signs of accumulation building at this level, the likelihood of a rebound is growing stronger.
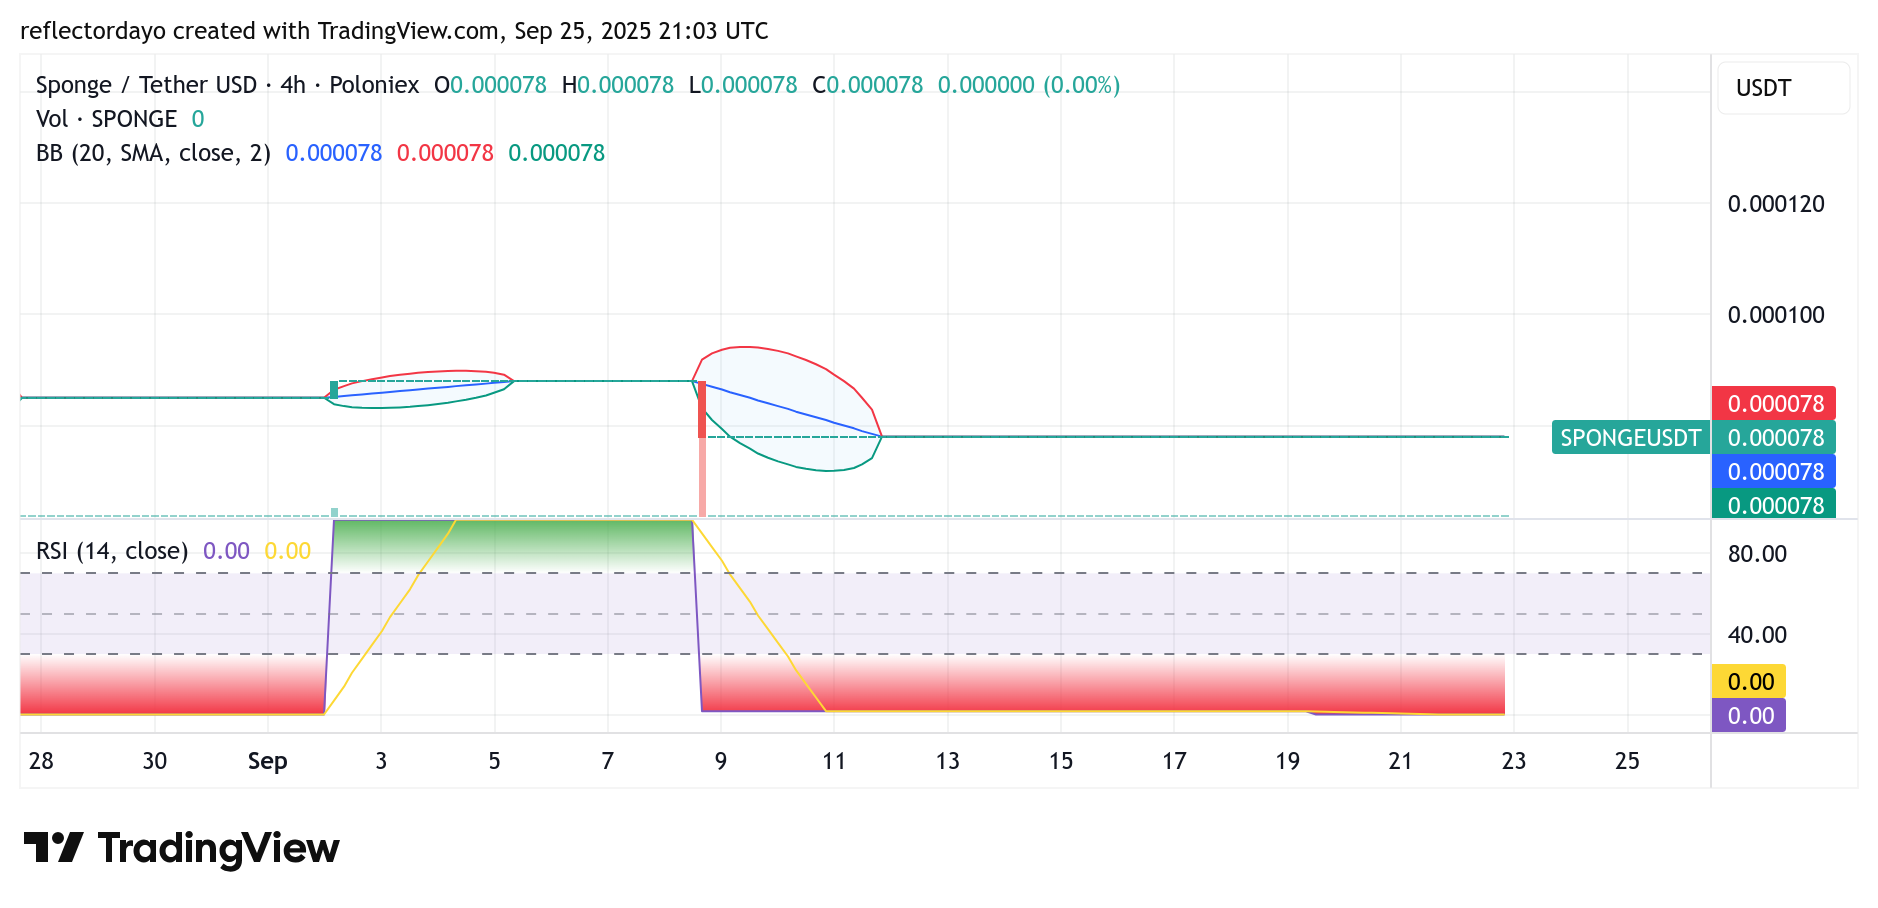
$SPONGE 4-Hour Chart Snapshot: Market Coiling for a Move
Zooming into shorter timeframes, price activity stays compressed around $0.000078, with $0.00008 serving as immediate resistance. A decisive breakout above this point could propel the market toward $0.0001. With the RSI firmly positioned in oversold territory, downside risks remain limited, and the bias leans toward a bullish reversal fueled by increasing momentum.
Buy SPONGE/USD!
When your bags pump and u go a lil crazy pic.twitter.com/AM0PqQIWYA
— $SPONGE (@spongeoneth) September 23, 2025
Join the SPONGE community and get in on the next big crypto opportunity! Buy Sponge ($SPONGE) today