Maker (MKR/USD) Bounces Back at the $1064 Price Level
Estimated Reading Time: 4 minutes
Don’t invest unless you’re prepared to lose all the money you invest. This is a high-risk investment and you are unlikely to be protected if something goes wrong. Take 2 minutes to learn more
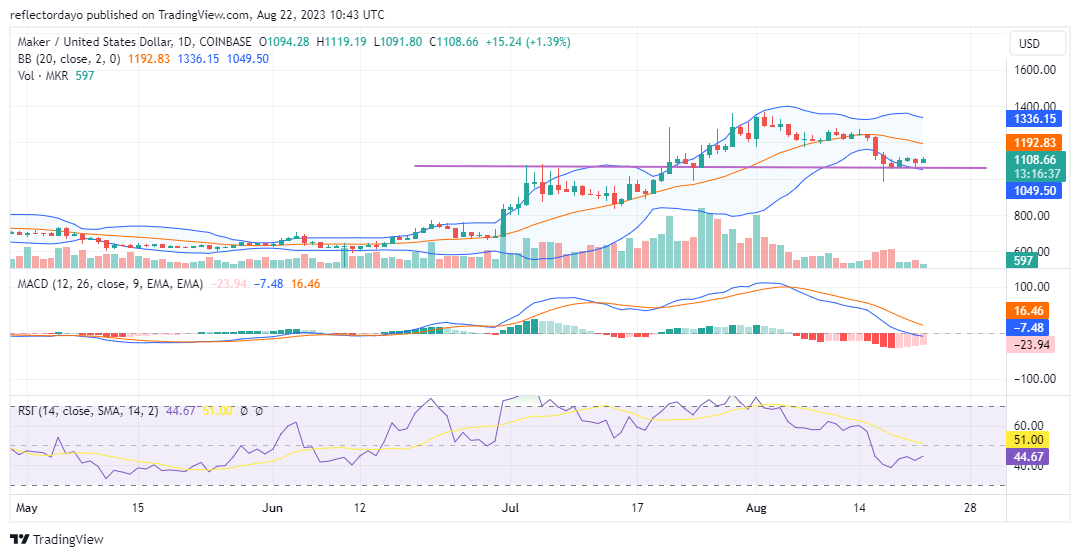
The price level of $1064 holds significant importance as a major demand zone. It is highly probable that the Maker market will experience a resurgence from this point on and proceed with its upward trajectory. When delving into historical data, it’s evident that the previous bullish rally was initiated precisely at this level on July 25. This led the market into a bullish phase that steered it toward the $1400 price point prior to the onset of the bearish market phase.
During this Maker bearish market period, a critical support point at $1064 played a pivotal role in halting the downward trend. Despite a test of the $1000 price mark by the bearish market, this attempt was swiftly rejected, causing the market to revert to the fundamental demand level at $1064. Should the pressure from the bearish side persist, the $1000 price level may emerge as the ultimate safeguard for maintaining the integrity of the ongoing bull market.
The Maker Market Data
- MKR/USD Price Now: $1112.30
- MKR/USD Market Cap: $1,083,964,093
- MKR/USD Circulating Supply: 977,631 MKR
- MKR/USD Total Supply: 977,631 MKR
- MKR/USD CoinMarketCap Ranking: #41
Key Levels
- Resistance: $1300, $1400, and $1450.
- Support: $1000, $950, and $900.
Price Prediction for Maker: The Indicators’ Point of View
On August 16 and August 17, we observed pronounced bearish price action; however, the volume of trade indicator lacks the robustness necessary to substantiate the extent of the bearish candlesticks on these days. This suggests a decline in the potency of the bear market’s influence as they approach this key demand level.
The volume of trade indicator is a representation of the total number of shares or contracts traded during a specific time frame. Substantial or noteworthy volume typically corroborates the intensity of a price movement. In the context of a bearish trend, elevated volume amid a downward trajectory can signify heightened selling pressure, reinforcing the bearish price behavior. Nevertheless, when volume fails to meet expected levels of significance despite the presence of prominent bearish candlesticks, it could be indicative of waning bearish sentiment. This is where the concept of divergence comes into play. By identifying divergence, we can support the perspective that anticipates a price increase from the current level.
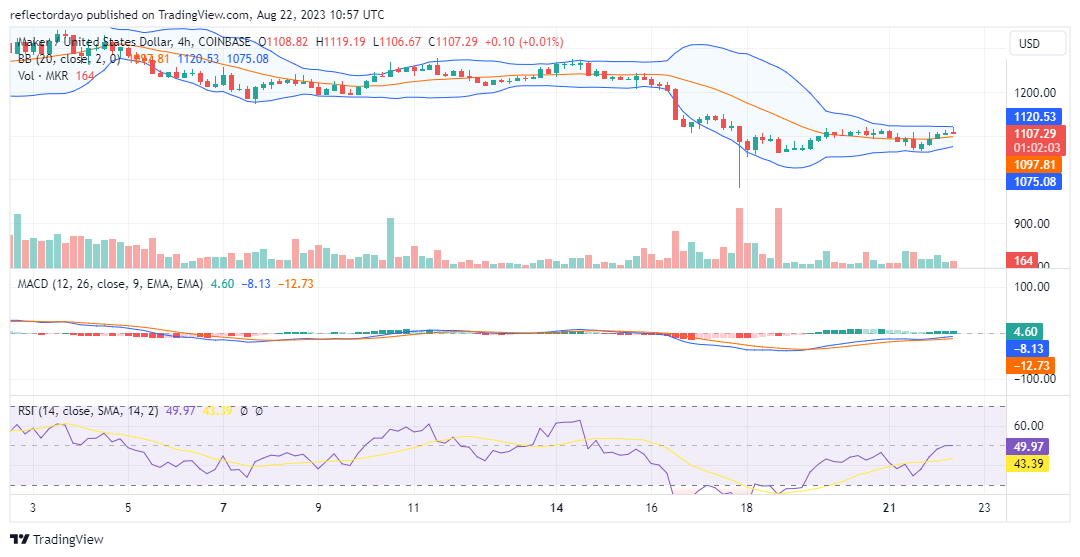
MKR/USD 4-Hour Chart Outlook
From this vantage point, the Bollinger Bands exhibit convergence, resulting in the formation of a notably narrow price channel. This phenomenon implies an impending breakout. Nonetheless, it’s worth noting that while the market has already commenced a bullish breakout, the bullish price movement hasn’t yet gained sufficient momentum, causing the market to remain confined within this constrained price channel.
Nevertheless, traders are advised to monitor the volume of trade indicator for validation before making investment decisions. In terms of the 4-hour chart perspective, despite the potential for a bullish price surge, the volume traded within the daily session remains subdued, thereby impeding the pace of recovery. Alternatively, the market might persist in ranging at its current level, potentially bolstering the strength of this particular price level.