Solana (SOL/USD) Price Is Debasing, Looking for Support
Estimated Reading Time: 3 minutes
Don’t invest unless you’re prepared to lose all the money you invest. This is a high-risk investment and you are unlikely to be protected if something goes wrong. Take 2 minutes to learn more
Solana Price Prediction – September 9
A chain of resistance has been staged around the $22 line, as confirmed by the crossing of indicators, given that the SOL/USD price is debasing and looking for support toward the point of $18.
The lingering falling pressure does not seem to have a significant impact on bulls’ potential to regain energy from around $18 ahead of anticipated rallying pressures. Prior to abandoning long positions in a shorting position order, plus and minus, investment strategy, and buying positions are to be initiated. .
SOL/USD Market
Key Levels:.
Resistance levels:$22, $24, $26
Support levels: $18, $16, $14
SOL/USD – Daily Chart
The SOL/USD daily chart showcases that the crypto-economic price is debasing beneath the interception of the SMAs, looking for support averagely above the spot price of $18.
As the positions of the moving averages have been set above at a great distance, the horizontal line has been drawn to show an underlying important point around the $18 support to indicate that sellers will probably not be able to push and hold for long underneath. The 50-day SMA is positioned below the 14-day SMA. Between 43.09 and 39.45, the stochastic oscillators are slightly crossing southward.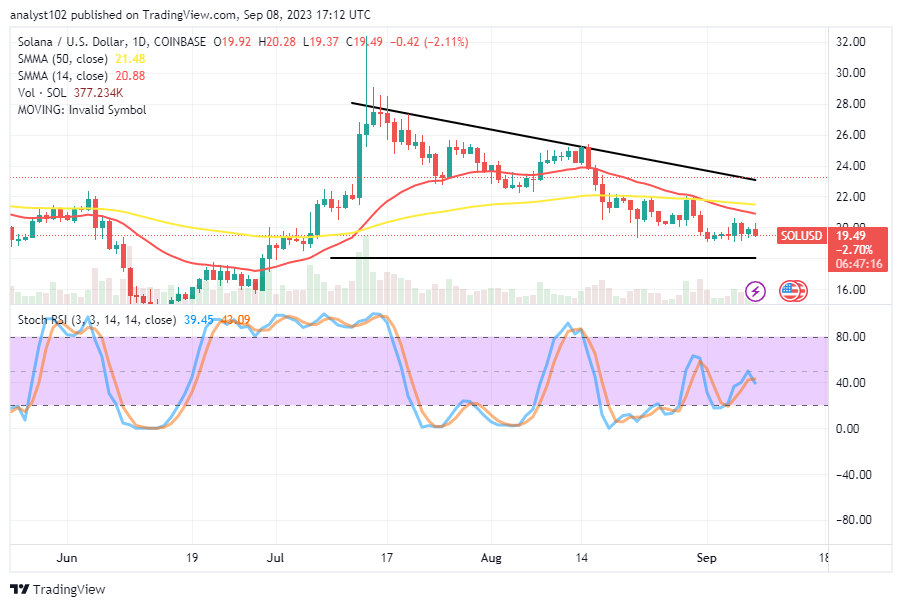
What is the most likely trend that the SOL/USD market will continue to follow?
Trade arenas between the points of the moving averages and the horizontal line drawn at a lower point of $18 will likely witness variant ranges in the following days, given that the SOL/USD market is debasing and looking for support toward the value line.
Long-position pushers should be cautious in their approaches at this stage and wait for an active rallying motion before entering a buy order. The current state of affairs indicates that the catalytic procedure will continue as long as the $18 support line is not crossed at the finish line.
As of the time this technical analysis was written, immediately executing a shorting order would put you in danger of quickly witnessing a comeback. Therefore, sellers should immediately set up a stop-loss order, particularly a little above the SMAs’ trend lines, to prevent unwarranted losses.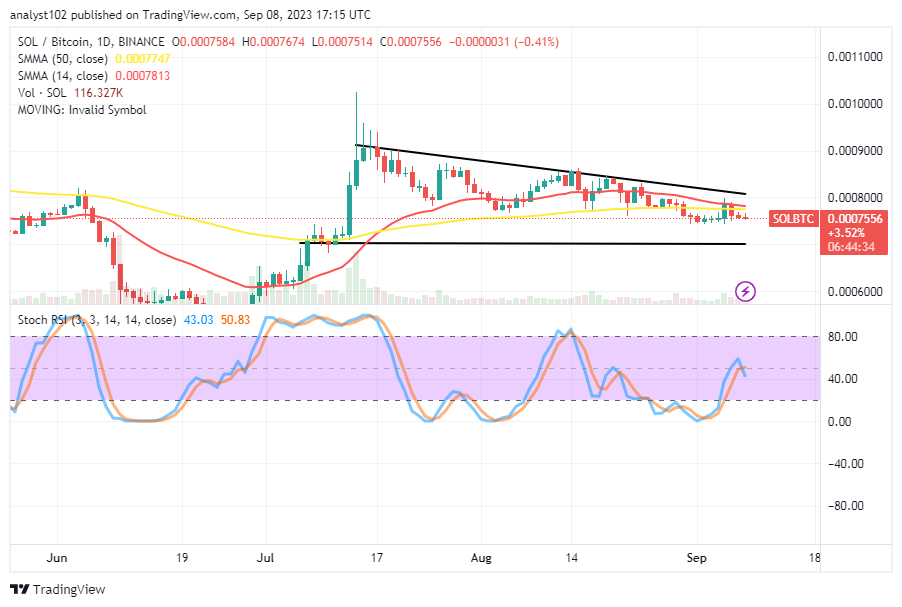
SOL/BTC Price Analysis
In contrast, Solana has slightly remained debasing against Bitcoin below the positioning stances of the moving averages, looking for support.
Closely positioned above the 50-day SMA trend line is the 14-day SMA trend line. From 50.83 to 43.03, the stochastic oscillators are attempting to cross back southward. The creation of the candlesticks at this time has been dominated by smaller bearish types. A bullish candlestick tending to occur at a given time will decimate the possibility of seeing further debasements in whatever method. Therefore, buyers should stay alert while that assumption appears.
Note: Cryptosignals.org is not a financial advisor. Do your research before investing your funds in any financial asset or presented product or event. We are not responsible for your investing results.
You can purchase Lucky Block here. Buy LBLOCK