Solana (SOL/USD) Market Is Dipping, Garnering a Bouncing Sign
Estimated Reading Time: 3 minutes
Don’t invest unless you’re prepared to lose all the money you invest. This is a high-risk investment and you are unlikely to be protected if something goes wrong. Take 2 minutes to learn more
Solana Price Prediction – September 1
The present southerly movement pace in the trade transactions of SOL/USD has been observed sipping and trying to breach past the logical lower-trading point of $20 as the crypto’s price is garnering a bouncing sign in the process along the line.
Even though the price is in a falling configuration, it is anticipated that this will only be a temporary situation because the price may just begin a completion course that won’t go below the $18 support level. The market’s bottom point as of this technical analysis is $19.70, with a minute average percentage rate of 0.56 positive.
SOL/USD Market
Key Levels:.
Resistance levels:$22, $24, $26
Support levels: $18, $16, $14
SOL/USD – Daily Chart
The SOL/USD daily chart showcases that the crypto market is dipping against the psychological point of $20, garnering a bouncing sign from around it.
Around the $22 resistance line, there has been a slight twitch of the larger moving average by the smaller moving average from the topside. The stochastic oscillators have crossed southward from 54.17 to 37.72 as a result of the mildly decreasing events. That suggests that bears are probably making their way toward the finish line shortly.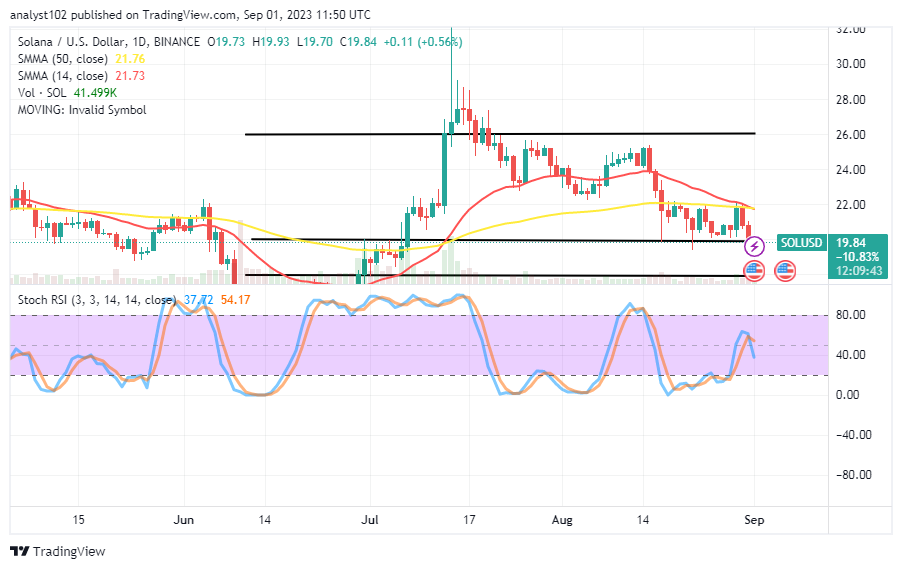
What could traders expect when the SOL/USD market is open and trading around the $20 mark?
A falling condition has been made around the $20 psychological line in the transactions involving Solana and the US coin, given that the crypto market is currently dipping and garnering a bouncing sign.
As things stand, buyers would need to exercise caution when entering the market because the stochastic oscillators have not been repositioned. Leaving that aside, if a bullish candlestick forms with its bottom centered around the price of $20, it will be sufficient to make a long position order if it does so prior to the oscillators moving upward at a specific time.
Pushers of short-term short positions may take a chance by opening sell orders at $20 when vigorous falling forces are visible, with hefty stop-loss orders executed near the resistance of $22. On the other hand, investors shouldn’t experiment with panic sales tactics.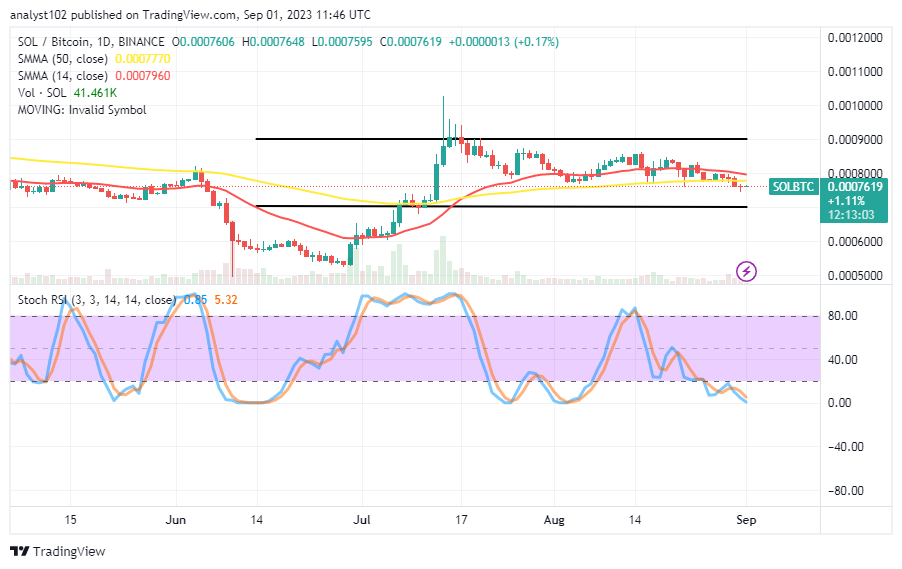
SOL/BTC Price Analysis
In contrast, Solana is range-bound, dipping slightly against the trending gravity of Bitcoin, garnering a bouncing sign with higher sideways trading channels.
The 50-day SMA trend line and the 14-day SMA trend line have both momentarily bent southward. The stochastic oscillators maintain values between 5.32 and 0.85 because they are oversold. To invalidate the remaining potential drops between the two cryptos and give bulls a reliable point of entry going forward, a circumstance must create a bullish candlestick.
Note: Cryptosignals.org is not a financial advisor. Do your research before investing your funds in any financial asset or presented product or event. We are not responsible for your investing results.
You can purchase Lucky Block here. Buy LBLOCK