Solana (SOL/USD) Trade Rebases, Conjecturing a Grow
Estimated Reading Time: 3 minutes
Don’t invest unless you’re prepared to lose all the money you invest. This is a high-risk investment and you are unlikely to be protected if something goes wrong. Take 2 minutes to learn more
Solana Price Prediction – August 19
In the wake of a retracement moving order in the market operations of SOL/USD from between the points of $26 and $25 in recent time, the crypto-economic trade rebases, conjecturing a growth from the support line of $20.
Given that the market is holding between $21.66 and $21.30, a positive percentage rate of 1.41 has emerged to determine the forces that buyers are keeping in their attempt to reclaim strength. As things stand right now, there can yet be a string of lower lows made on purpose to test the trade support level of $20 and regain the upward momentum.
SOL/USD Market
Key Levels:.
Resistance levels:$24, $26, $28
Support levels: $20, 18, 16
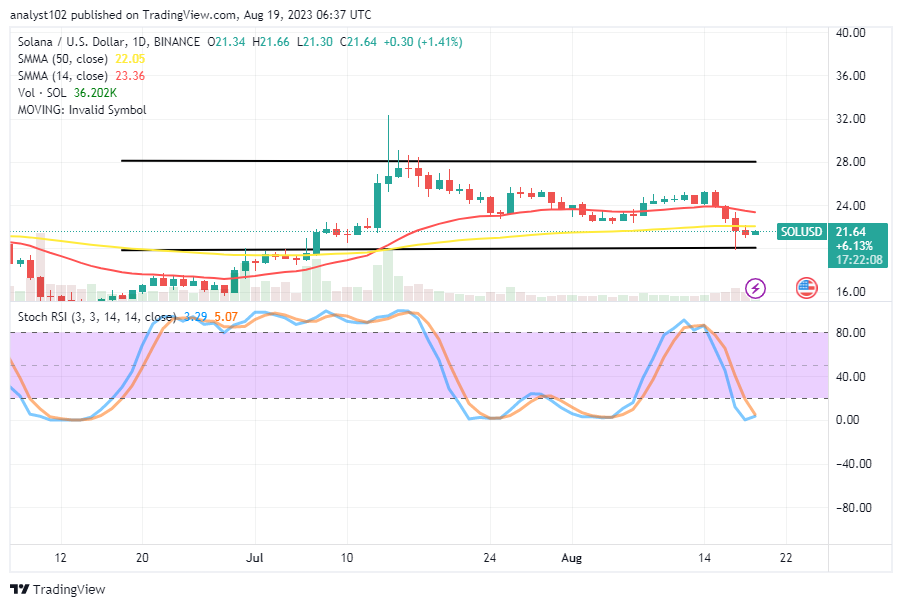
SOL/USD – Daily Chart
The SOL/USD daily chart showcases the crypto-economic trade rebases, conjecturing growth from the business line support of $20.
The 50-day SMA trend line is at $22.05 and is above the 14-day SMA trend line at $23.36. Currently, a tiny bullish candlestick is seen from beneath the larger moving average. The stochastic oscillators have penetrated the oversold region, trying to cross northbound from the values of 3.29 to 5.07, affirming that an upward-rising moment is in the offing.
Is it theoretically viable to resume opening long positions excellent around the 50-day SMA of the SOL/USD market?
As there have been less active forces to the downside below the moving averages, the SOL/USD market long-position placers are expected to start pressing for variant buying orders given that the crypto trade rebases, conjecturing a grow.
Buying zones have now formed between the line of $20 and the value of the bigger SMA, which is at $22.05. A sudden southward breach of the support level will possibly extend to a lower support zone of $18 to rebuild their rallying motion.
Technically speaking, given the southward trending nature of the SOL/USD market activities, sellers may need to hold off on resuming a short position until a pullback to test the smaller SMA’s trade resistances or the $24 barrier line.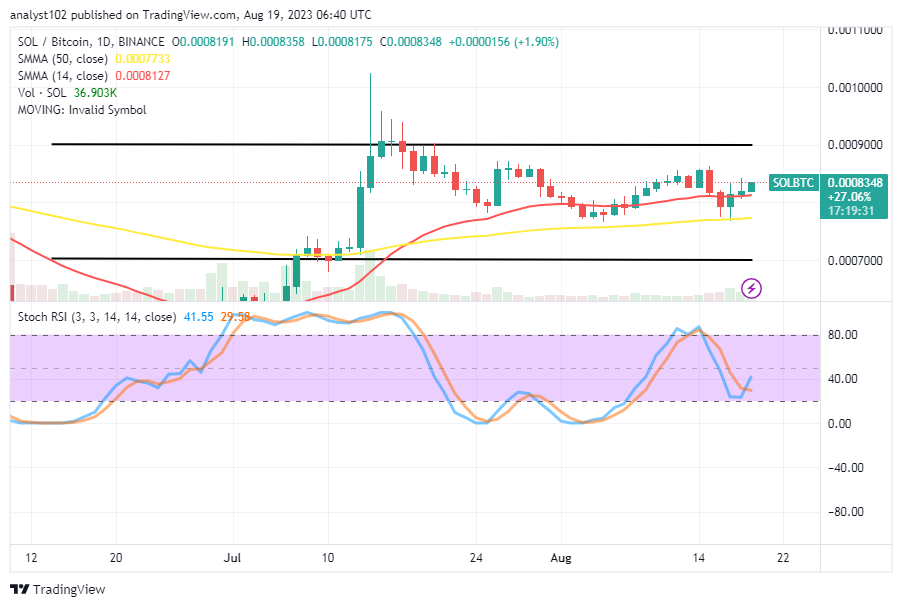
SOL/BTC Price Analysis
In contrast, the Solana market rebases at the buy signal point of the bigger moving average against Bitcoin, conjecturing growth in the process of recovering some lost higher points in recent times.
Above the 50-day SMA indication is the 14-day SMA indicator. The narrower trend line has just barely crossed over to the north side. The stochastic oscillators have touched down at the 20 level initially. And they are struggling to cross northbound from 29.58 to 41.55. With that arrangement in place, the base cryptocurrency will dwell further on an increasing motion in the following business activities.
Note: Cryptosignals.org is not a financial advisor. Do your research before investing your funds in any financial asset or presented product or event. We are not responsible for your investing results.
You can purchase Lucky Block here. Buy LBLOCK