Solana (SOL/USD) Market Truncates a Retracement, Goes Rallying
Estimated Reading Time: 3 minutes
Don’t invest unless you’re prepared to lose all the money you invest. This is a high-risk investment and you are unlikely to be protected if something goes wrong. Take 2 minutes to learn more

Solana Price Prediction – August 10
The present situational financial reports as per the happenings in the SOL/USD trade operations show the crypto-economic market truncates a retracement moving process against the worth of the US coin and is rallying to make up some lost increased values.
For the time being, certain actions focus on pushing pressure in the direction of the north to average a $26 resistance trade zone, which is now the first trading barrier in front of it. The bulls are currently pushing maximally at a line of $24.86, maintaining a positive percentage rate of 1.23. This is according to this technical article.
SOL/USD Market
Key Levels:.
Resistance levels:$28, $30, $32
Support levels: $21 $19, $17
SOL/USD – Daily Chart
The SOL/USD daily chart showcases that the crypto-economic market truncates a retracement and goes rallying at a less reasonable pace toward the resistance of $26.
The 14-day SMA indicator is placed at $23.59 above the $21.80 market value of the 50-day SMA indicator. Upper and lower horizontal lines are drawn at $28 and $20 to mark up and down the strategically placed values within which both the muscles of buyers and sellers are being measured. The Stochastic Oscillators have curved northbound from the oversold region to place between 57.78 and 78.79 points.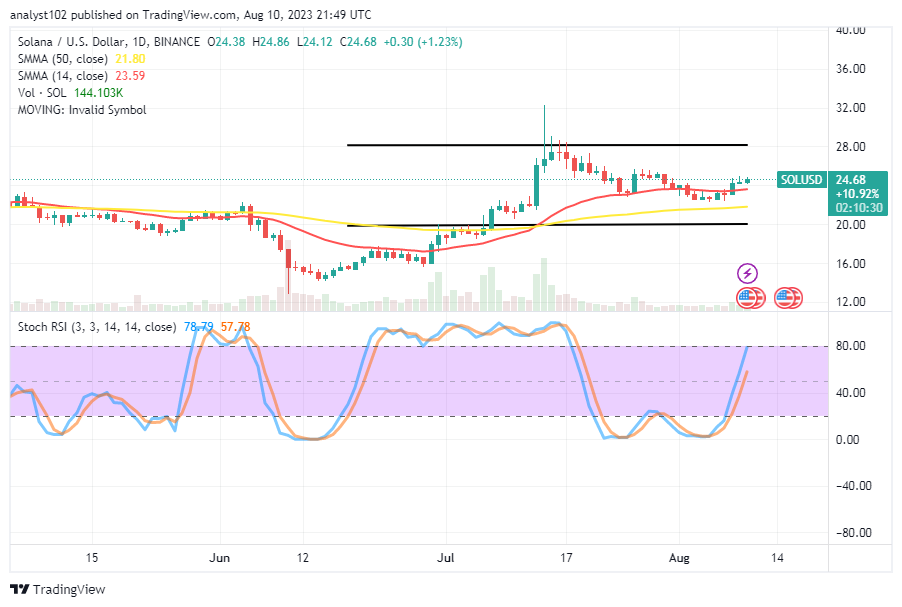
Should sellers on the SOL/USD market hold off on placing an order until the oscillators have reached the overbought region?
It would be highly technically ideal for the SOL/USD market bears to exercise patience toward getting an overbought reading condition of the crypto business before executing shorting orders due to the fact that the market truncates a retracement pushing course and goes rallying into a recovery mode.
In general, the current trade situation still has the capacity to move slowly and steadily northward in order to exhaust the capacity force applied to the muster-up motion. If that presumption is correct, the $21 underlying support line shouldn’t be crossed anytime soon by any reversal swings.
Until a scary upsurge appears and turns against it around the previously accomplished resistance-trading zones, as seen below the upper trade resistance of $32, selling operations must be put on hold. By doing this, sellers will be less exposed to the possibility of suffering enormous losses.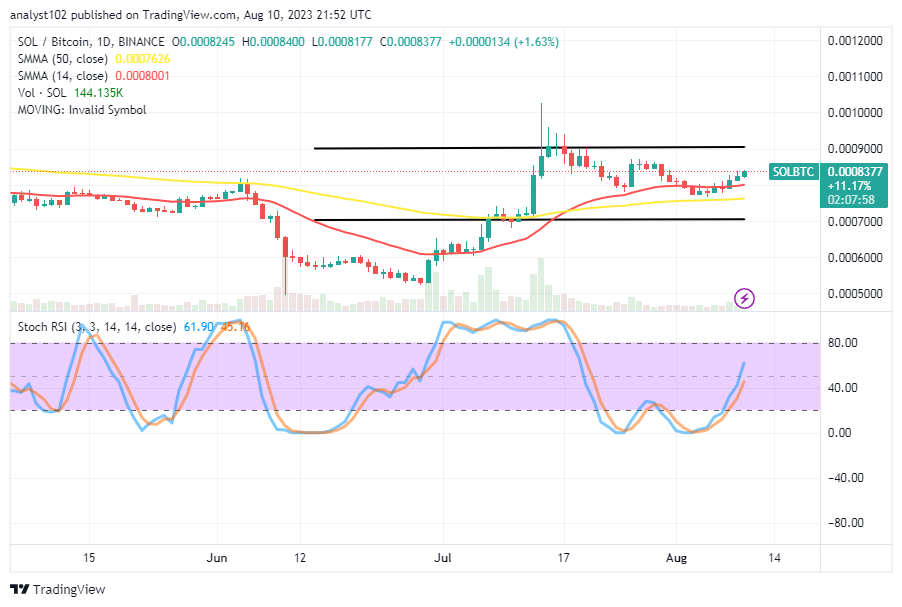
SOL/BTC Price Analysis
In contrast, the Solana market truncates a retracement movement against the trending ability of Bitcoin that has been countering it, and it is currently rallying on the buy signal side of the lighter Moving Average.
Compared to the 50-day SMA trend line, the 14-day SMA trend line is higher. And at greater distances from the indicators, well-defined horizontal lines have been drawn to represent them. The stochastic oscillators have moved from the oversold area to a position between 45.16 and 61.90 in a northward direction. Conclusion: The base cryptocurrency is gradually shifting into high gear to drive against its counter-crypto instrument.
Note: Cryptosignals.org is not a financial advisor. Do your research before investing your funds in any financial asset or presented product or event. We are not responsible for your investing results.
You can purchase Lucky Block here. Buy LBLOCK