Hedera Hashgraph (HBAR/USD) Reaches Yearly High and Holds Strong
Estimated Reading Time: 3 minutes
Don’t invest unless you’re prepared to lose all the money you invest. This is a high-risk investment and you are unlikely to be protected if something goes wrong. Take 2 minutes to learn more

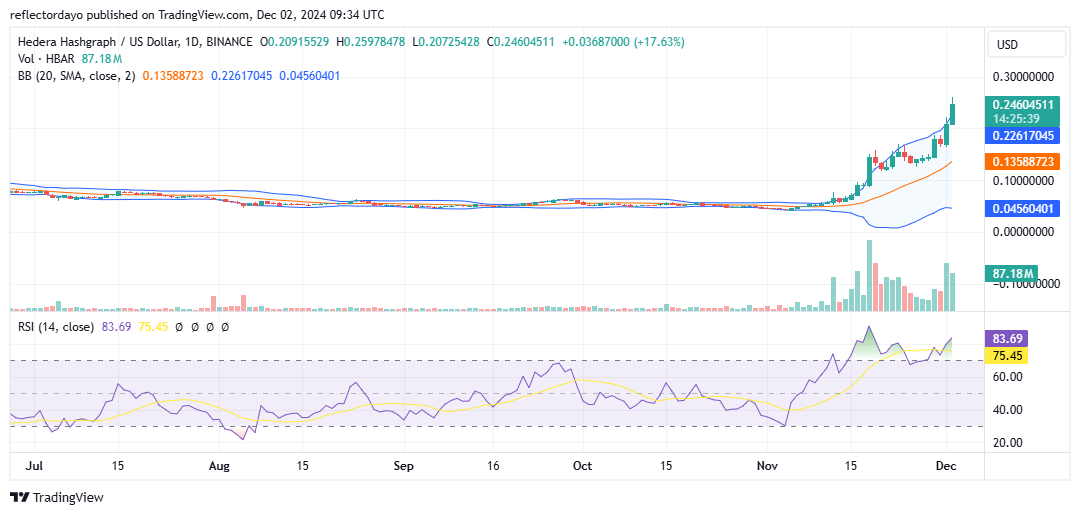
After an extended period of conservative sentiment resulting in minimal price swings in either direction, the market has finally broken through the critical $0.20 price level. This breakout could potentially attract stronger bullish momentum. However, after reaching a peak of $0.26, the market is undergoing a downward correction, likely driven by profit-taking from long-position holders. The new critical resistance level is now established at $0.26.
Hedera Hashgraph Market Data
- HBAR/USD Price Now: $0.24
- HBAR/USD Market Cap: $9.4 billion
- HBAR/USD Circulating Supply: 38 billion HBAR
- HBAR/USD Total Supply: 50 billion HBAR
- HBAR/USD CoinMarketCap Ranking: #19
Key Levels
- Resistance: $0.26, $0.30, and $0.35
- Support: $0.20, $0.15, and $0.14.
Hedera Hashgraph Through the Lens of Indicators
The Hedera Hashgraph market experienced a significant shift when price action, after a prolonged period of consolidation, successfully broke above the $0.10 price level. This breakout attracted increased bullish sentiment, driving a steady upward momentum. Although a brief period of resistance emerged at the $0.133 price level, lasting several days, the bulls ultimately regained control, pushing the price above $0.20 to achieve a yearly high.
This ongoing tug-of-war between buyers and sellers has heightened market volatility, as evidenced by the widening of the Bollinger Bands. Additionally, trading volume has been characterized by notable spikes, reflecting increased market activity. However, the Relative Strength Index (RSI) is signaling caution, with the RSI line now positioned in the overbought zone, indicating that the market’s momentum may be overstretched.
Investors are advised to wait for a confirmed support level in the crypto signal before entering the market, as the overall bullish bias remains intact.
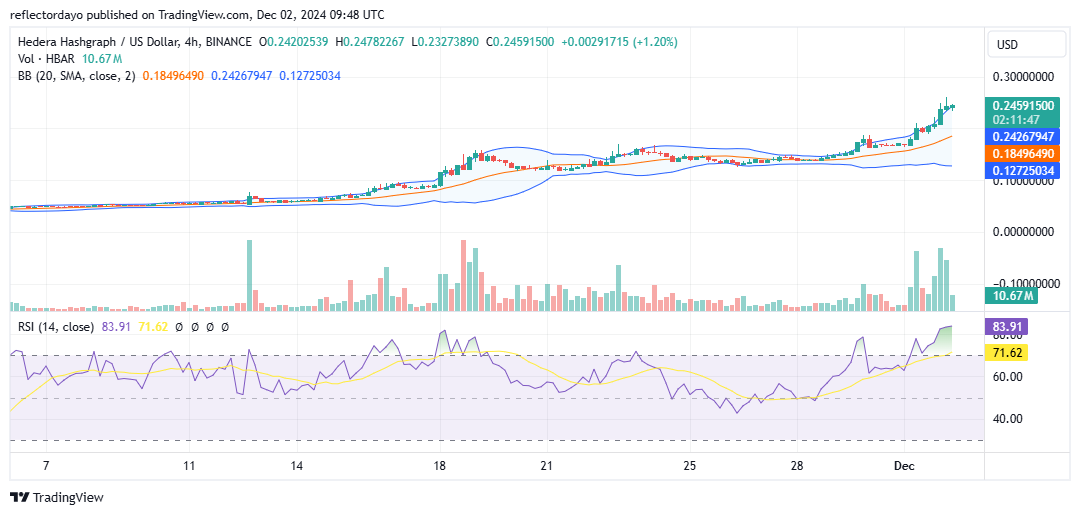
HBAR/USD Price Prediction: 4-Hour Chart Analysis
The key resistance level at $0.26 is becoming increasingly evident as candlestick patterns indicate a temporary decline in bullish momentum. The trading volume indicator reflects a reduction in histogram heights, while the Relative Strength Index (RSI), currently measuring 83, suggests that the market may be gearing up for a correction.
Investors are advised to consider re-entering the market around the $0.20 price level, as it has now emerged as a critical support level.