Polygon (ex-MATIC) Price Prediction: POL/USDT Bulls Rise Back to Prominence
Estimated Reading Time: 3 minutes
Don’t invest unless you’re prepared to lose all the money you invest. This is a high-risk investment and you are unlikely to be protected if something goes wrong. Take 2 minutes to learn more

Date: May 10, 2025
The price action of Polygon (ex-MATIC) has continued to move upward. It all began when the price broke above the $0.2000 level. As trading progressed, the market sustained this upward momentum and is now trading above the $0.2500 mark. Let’s delve deeper below.
POL/USDT Long-Term Trend: Bullish (Daily Chart)
Key Price Levels:
Resistance: $0.3000, $0.3500, $0.4000
Support: $0.2500, $0.2000, $0.1500
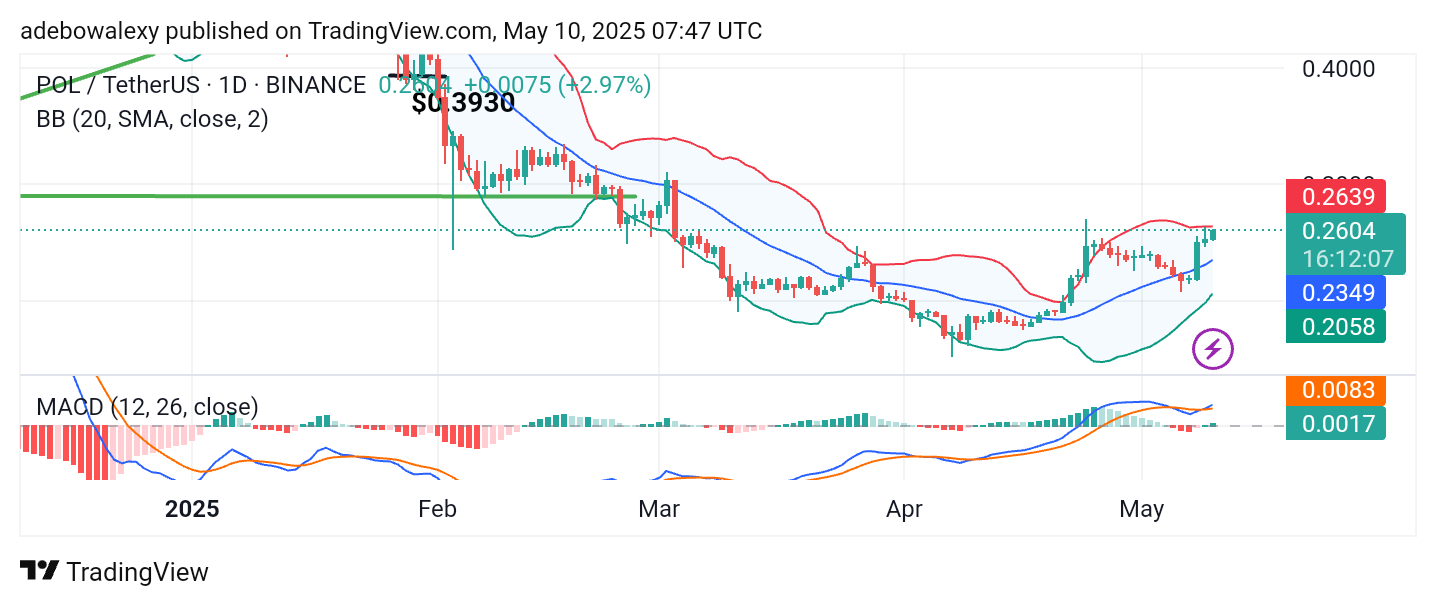
Trading activity in the Polygon (ex-MATIC) daily chart has continued upward. Green price candles have appeared over the past three sessions, reflecting sustained bullish momentum. The ongoing session remains bullish, as indicated by the most recent candle on the price chart. The Bollinger Bands indicator shows a slight upward tilt. Similarly, the Moving Average Convergence Divergence (MACD) indicator lines are now positioned above the equilibrium level. Additionally, these lines recently completed a bullish crossover above the equilibrium line, reinforcing the positive outlook.
Polygon (ex-MATIC) Price Prediction: POL/USDT Eyes the $0.3000 Price Level
Technical indicators from the Polygon (ex-MATIC) price chart suggest a sustained upward move. The current session also shows moderately increasing bullish momentum, as evidenced by the formation of corresponding price candles.
Furthermore, price action near the upper limit of the Bollinger Bands suggests continued strength. The MACD indicator also shows both lines positioned above the equilibrium level, with the recent bullish crossover gaining traction. The histogram bars of the MACD indicator have also started to rise above the equilibrium level, further confirming bullish activity in the market.
Polygon (ex-MATIC) Price Prediction: POL/USDT Maintains Bullish Momentum
On the 4-hour chart of Polygon (ex-MATIC), bullish forces remain dominant. The last two price candles are green, indicating continued upward movement. Consequently, price action remains close to the upper band of the Bollinger Bands indicator, which itself is tilted upward.
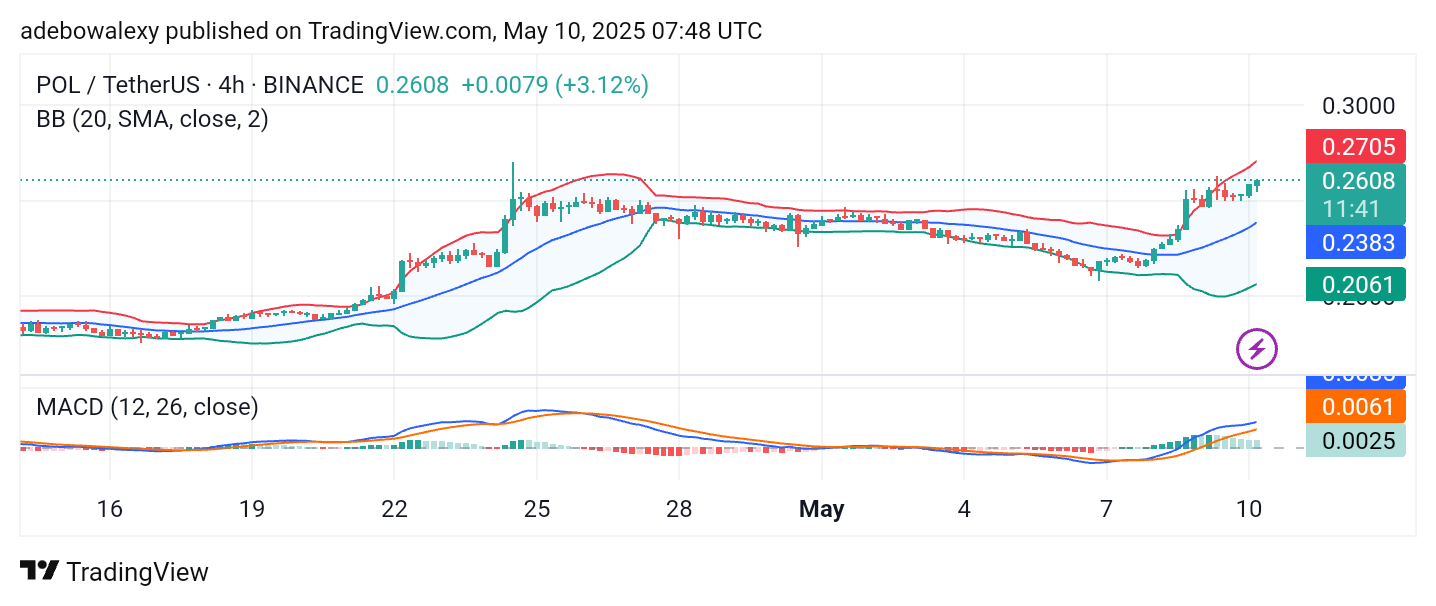
The MACD lines are also above the equilibrium level and maintain an upward trajectory. Although the MACD histogram bars are pale green—likely due to a recent market pause that occurred three to five sessions ago—the bullish trend appears to be resuming. Traders may aim for the $0.3000 price level as a near-term target.