Solana (SOL) Price Prediction: SOL/USDT Resurfaces Above the $160 Price Level
Estimated Reading Time: 2 minutes
Don’t invest unless you’re prepared to lose all the money you invest. This is a high-risk investment and you are unlikely to be protected if something goes wrong. Take 2 minutes to learn more

Date: May 9, 2025
Solana has been increasing ever since the Bitcoin market began retracing upward toward the $100K price mark. As the Solana market continues to track Bitcoin’s performance, the SOL token is now trading just above the $160 price level.
SOL/USDT Long-Term Trend: Bullish (Daily Chart)
Key Price Levels:
Resistance: $170, $180, $190
Support: $150, $140, $130
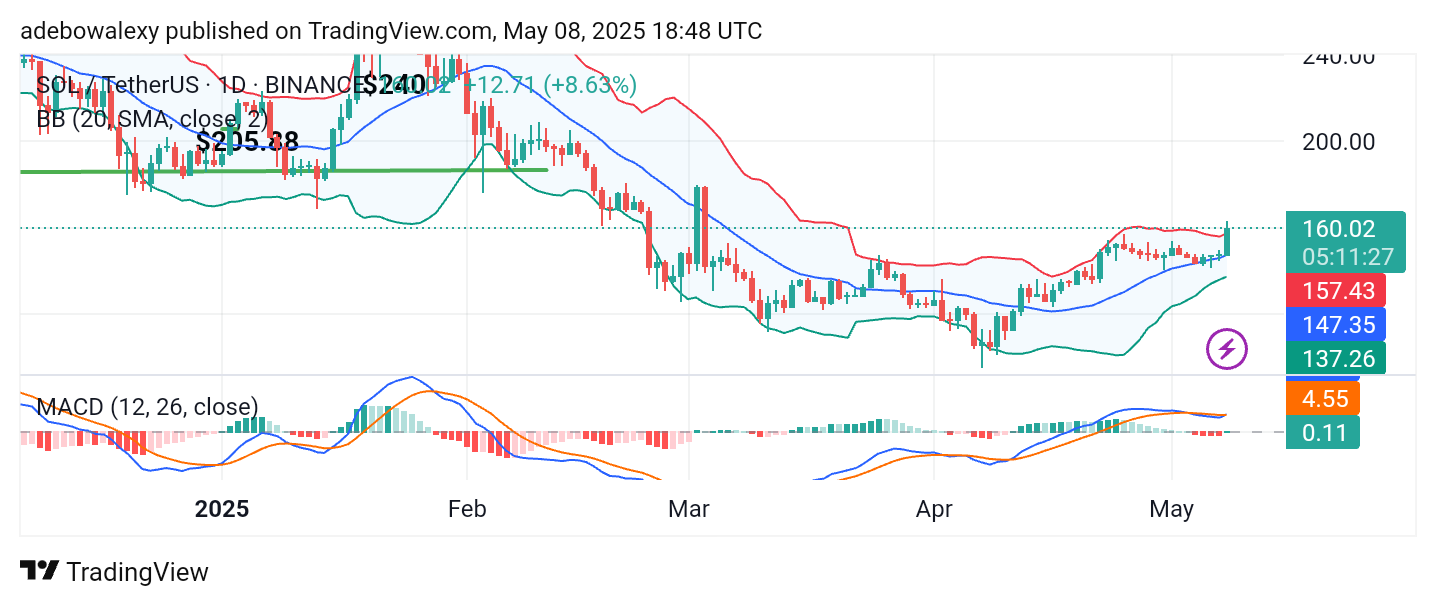
Bullish momentum in the Solana market appears to have strengthened considerably in the ongoing session. This can be observed through the most recent price candle on the daily chart, which now positions the token outside the upper limit of the Bollinger Bands. At the same time, the Moving Average Convergence Divergence (MACD) indicator shows signs of an upward crossover above the 0.00 level, reinforcing bullish momentum.
Solana (SOL) Price Prediction: SOL/USDT May See Further Upside Retracement
The combination of technical indicators on the Solana daily chart strongly suggests the potential for further price increases. The ongoing session is bullish, pushing through key resistance levels. The latest price candle has placed SOL above the upper band of the Bollinger Bands.
Although minor downward contractions have occurred, bullish pressure has been strong enough to retain most of the recent gains. Meanwhile, the convergence of the MACD lines also indicates rising momentum, which may drive the market toward higher price levels in the near term.
Solana (SOL) Price Prediction: SOL/USDT Bulls Are Standing Strong
Price activity in Solana continues to hug the uppermost limit of the Bollinger Bands—an indication of sustained bullish strength. Even on the shorter 4-hour time frame, SOL remains outside the upper Bollinger Band.
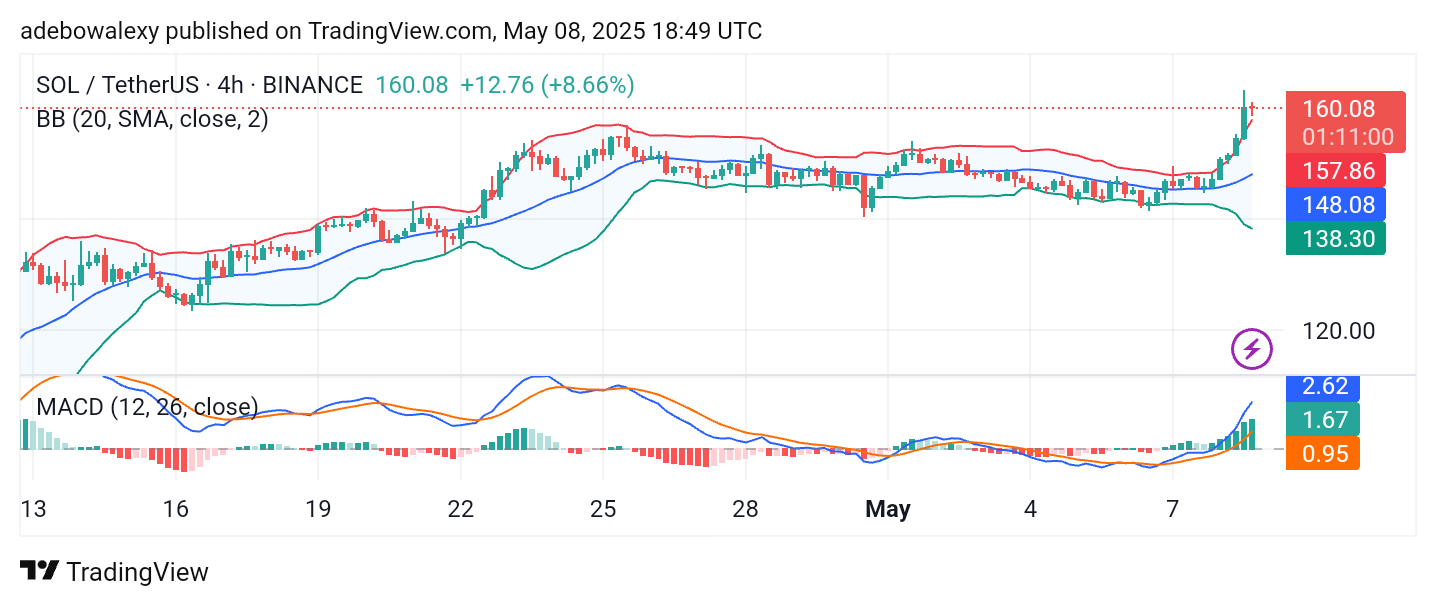
Additionally, the MACD lines continue to rise sharply above the equilibrium level, with solid green histogram bars forming above the baseline. Consequently, these technical indicators support the view that price action may continue advancing, with the potential to reach the $165 or even $170 resistance level in the short term.