Uniswap (UNI) Price Prediction: UNI/USDT Now Targets the $5.50 Mark
Estimated Reading Time: 2 minutes
Don’t invest unless you’re prepared to lose all the money you invest. This is a high-risk investment and you are unlikely to be protected if something goes wrong. Take 2 minutes to learn more

Date: May 8, 2025
The Uniswap market is tracking the continued growth of Bitcoin’s price toward the $100K mark. Although the Uniswap market seems to be generally consolidating at the moment, there are indications that hint at a possible continuation of growth.
UNI/USDT Long-Term Trend: Bullish (Daily Chart)
Key Price Levels:
Resistance: $5.50, $6.00, $7.00
Support: $5.00, $4.50, $4.00
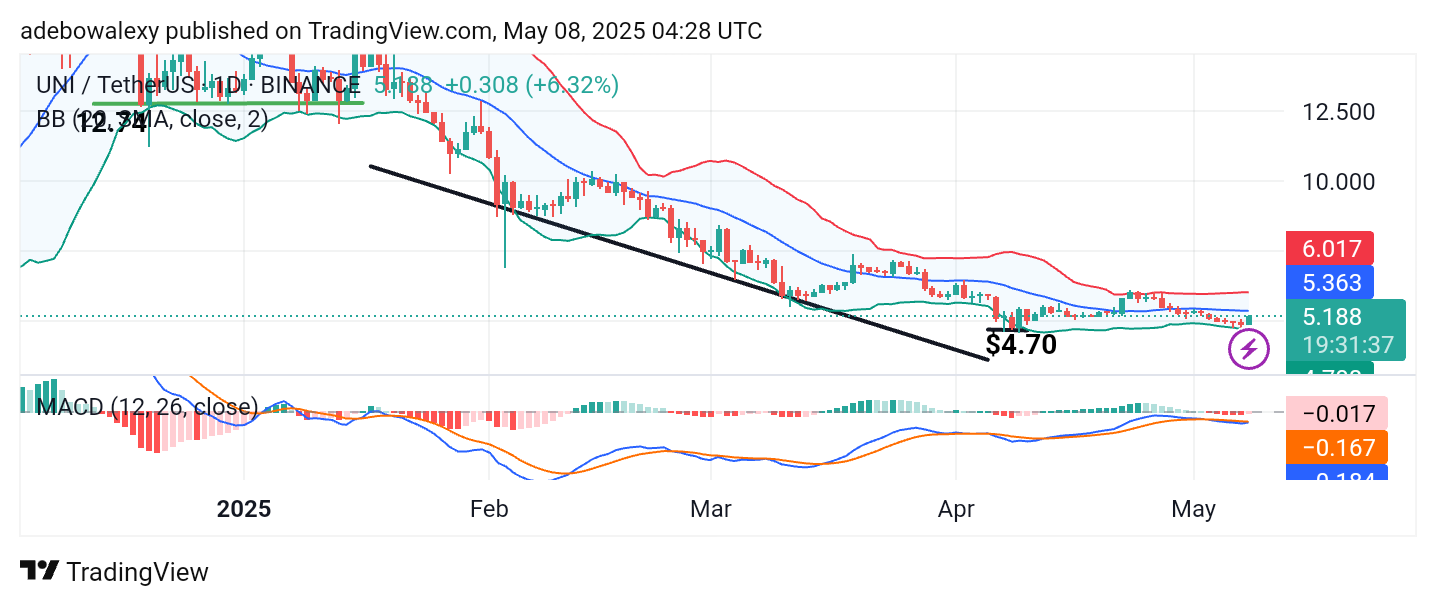
The Uniswap market has recorded a rebound off the lower band of the Bollinger Bands indicator. This rebound occurred within a single session and still places the price of the token below the middle band of the Bollinger Bands. The Moving Average Convergence Divergence (MACD) lines are still below the 0.00 mark. However, the lines of this indicator appear to be moving sideways, and the height of the MACD histogram bars seems short enough to suggest that downward momentum is weakening and under suppression.
Uniswap (UNI) Price Prediction: UNI/USDT Market Needs More Push
The upside retracement in the Uniswap daily market appears spontaneous. Yet, it hasn’t brought much progress in terms of price movement.
As a result, price action in this market remains around a key technical level—the middle band of the Bollinger Bands. Likewise, the MACD lines and histogram bars remain below equilibrium. Therefore, for long-term targets to be realized, price action needs to break above the middle band of the Bollinger Bands.
Uniswap (UNI) Price Prediction: UNI/USDT Pushes Limits Too Soon
Following the upside rebound observed in the Uniswap daily market, the 4-hour price chart shows that price action has reached the upper band of the Bollinger Bands. As a result, the price is beginning to contract significantly.
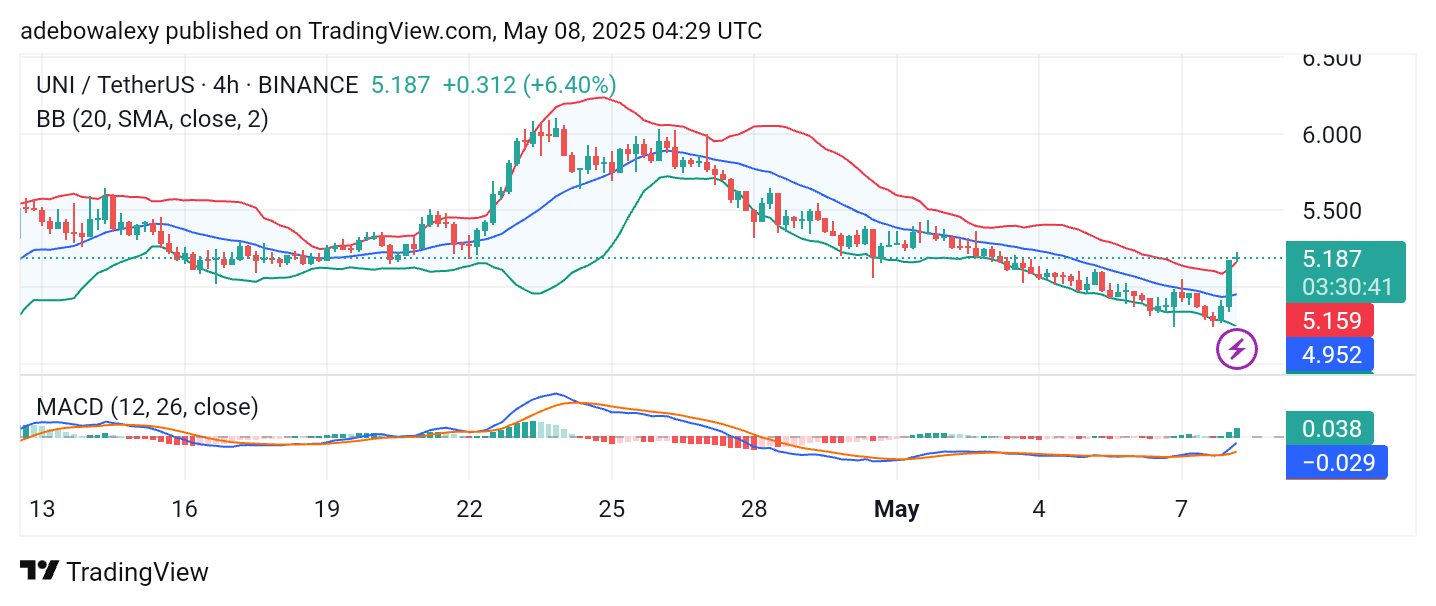
Contrary to the daily chart activity, the MACD histogram bars on the 4-hour chart now appear above the equilibrium level. Nevertheless, the MACD line remains below the equilibrium but is trending upward. Therefore, it appears that only short-term targets, such as the $5.50 price level, have a higher chance of being achieved in the near term.