The Sui Market (SUI/USD) Maintains Momentum Amid Ongoing Bullish Recovery
Estimated Reading Time: 3 minutes
Don’t invest unless you’re prepared to lose all the money you invest. This is a high-risk investment and you are unlikely to be protected if something goes wrong. Take 2 minutes to learn more
Following the establishment of a key support level at $2.50—which effectively halted the downward trend from the $4.30 mark—the SUI/USD market has been undergoing a steady bullish recovery. Over the past few weeks, growing positive sentiment has enabled the market to break through successive resistance zones, with price action now pushing toward the $3.50 level.
Notably, bullish activity intensified between yesterday and today, contributing to an uptick in market volatility. While this momentum reflects increased buying interest, it may also set the stage for a potential price correction as traders begin to take profits at major resistance levels.
The Sui Market (SUI/USD) Market Data
- SUI/USD Price Now: $3.234
- SUI/USD Market Cap: $11 billion
- SUI/USD Circulating Supply: 3.45 billion SUI
- SUI/USD Total Supply: 10 billion SUI
- SUI/USD CoinMarketCap Ranking: #12
Key Levels
- Resistance: $3.500, $4.00, and $4.500
- Support: $2,800, $2,500, and $2.00
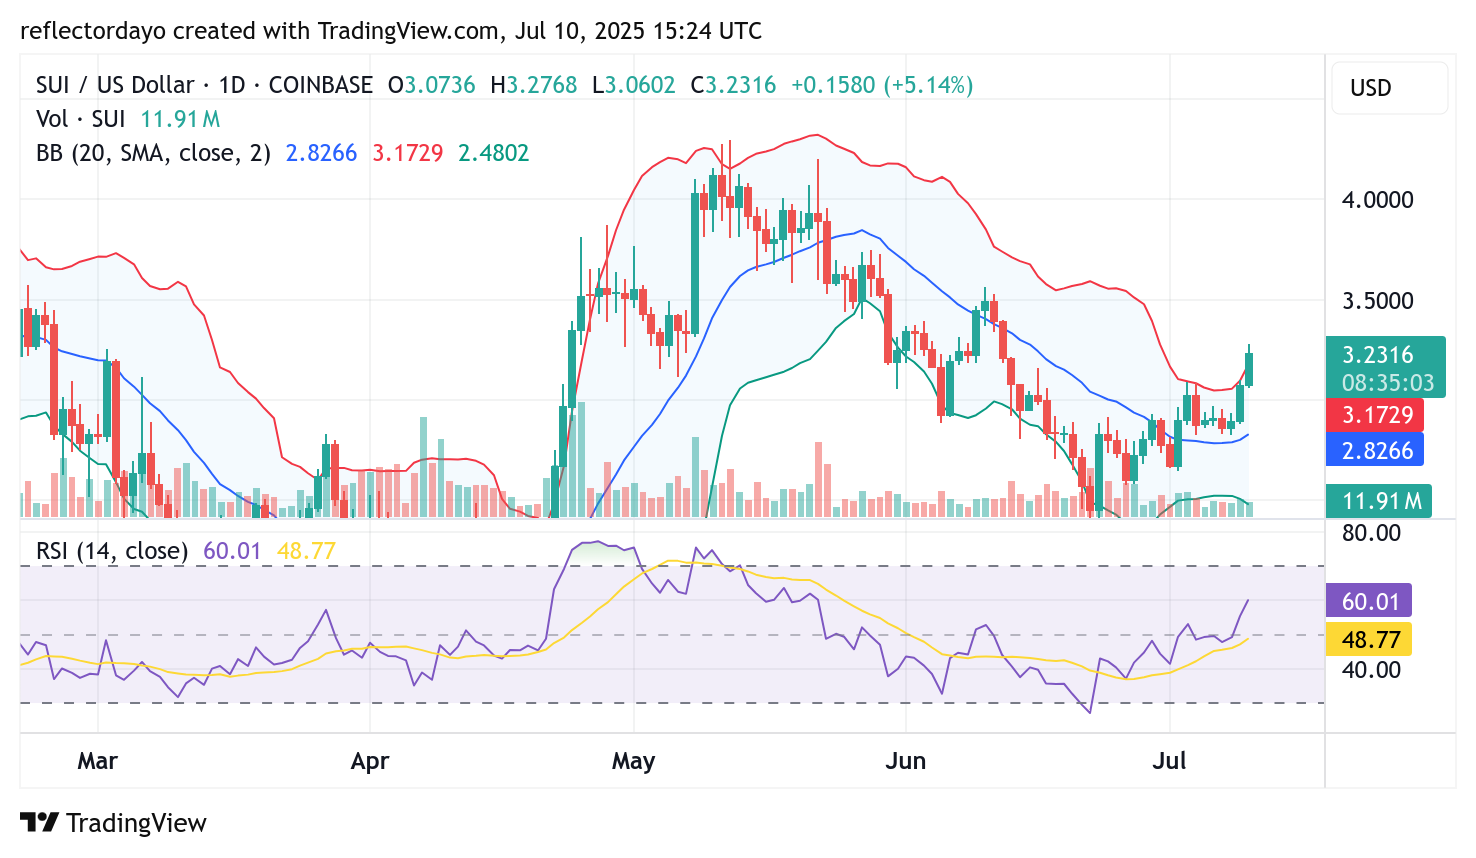
The Sui Market (SUI/USD) Daily Chart Outlook
Between yesterday and today, the Sui (SUI/USD) market has experienced a wave of positive sentiment among traders and analysts—driven by strong fundamentals and robust on-chain activity. On the previous trading day, SUI successfully broke above the critical $3.00 price level, and today, it has managed to hold above that threshold, with momentum pushing toward the $3.50 mark.
However, price action is currently encountering resistance around $3.27. If the bulls fail to gain control at this level, a short-term correction could occur, potentially bringing the price down to retest the higher support zone near $3.10. This level may serve as a springboard for renewed buying interest, potentially reigniting the bullish trend.

SUI/USD 4-Hour Chart: Signs of Potential Correction Emerge
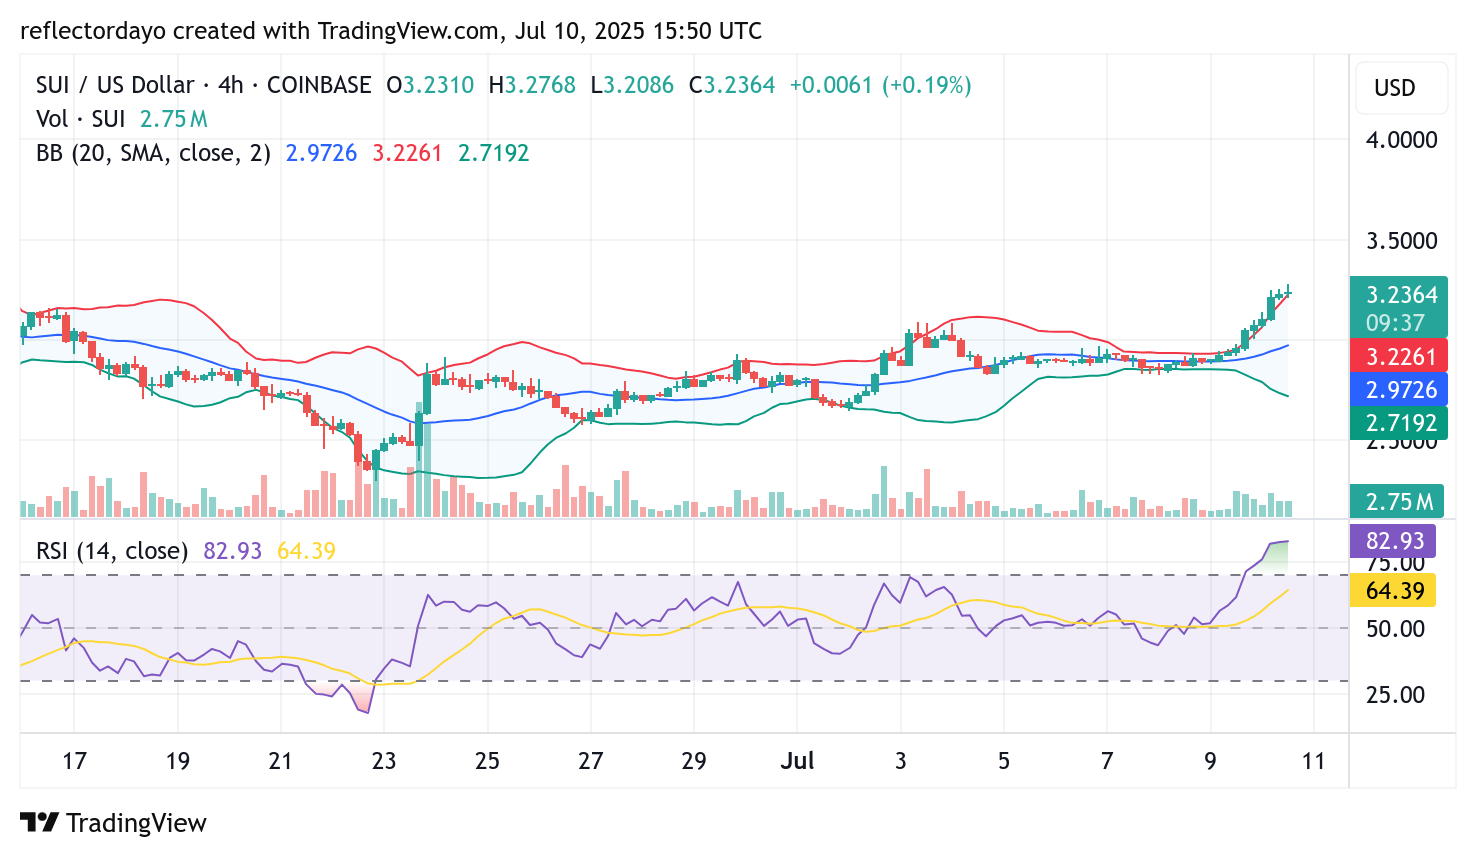
A closer look at the SUI/USD 4-hour chart reveals early signals of a possible market correction. The widening divergence of the Bollinger Bands, combined with the appearance of multiple Doji candlesticks near the recent highs, suggests that bullish momentum may be weakening—an indication of potential exhaustion.
Supporting this outlook, the Relative Strength Index (RSI) is advancing deep into the overbought territory, reinforcing the case for a pullback. Given these technical signals, traders should prepare for a possible short-term correction. If a retracement occurs, attention should shift to the $3.10 level, where a higher support base may potentially form and sustain the broader bullish trend.