Uniswap (UNI/USD) Market Prices Lower Below $6
Estimated Reading Time: 3 minutes
Don’t invest unless you’re prepared to lose all the money you invest. This is a high-risk investment and you are unlikely to be protected if something goes wrong. Take 2 minutes to learn more
Uniswap Price Prediction – November 26
The impacts of declining motions in the UNI/USD trade have continued to keep buying and selling activities under a downward-trending outlook as the crypto market prices lower below $6 at a close-range spot. The situation produces that the market is around the 1.70 percentage rate, trading around $5.50 approximately, with is a positive sign.
UNI/USD Market
Key Levels:
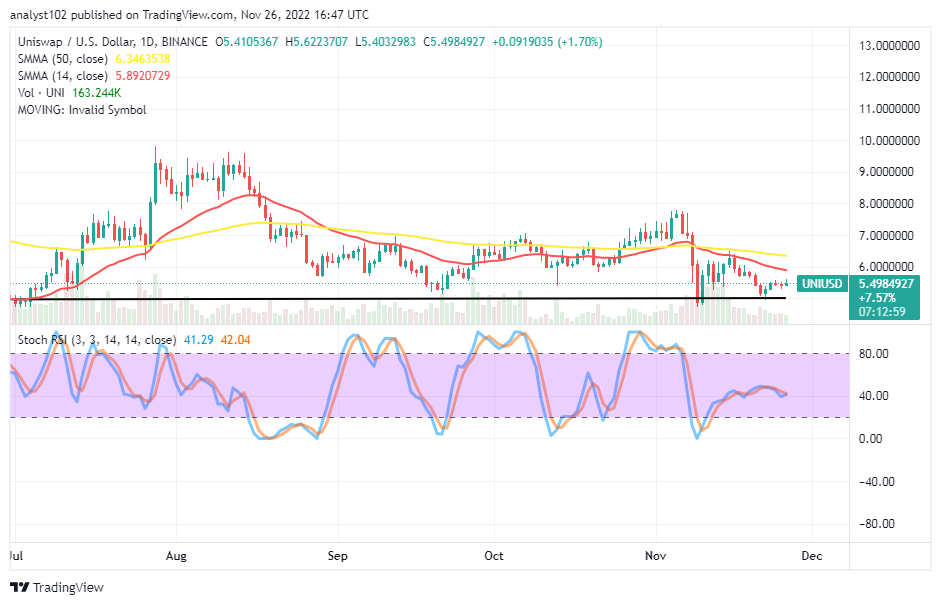
Resistance levels: $6.50, $7, $7.50
Support levels: $5, $4.50, $4
UNI/USD – Daily Chart
The UNI/USD daily chart showcases that the crypto market prices are lower below the $6 trading level of the SMA trend lines. The 14-day SMA indicator is around $5.89, underneath the 50-day SMA indicator, which is around the $6.35 value line. The baseline remains drawn at the $5 support level. The Stochastic Oscillators have somewhat curved southbound around the 42.04 and 41.29 levels. And with the formation of current candlesticks indicates indecision is materializing.
Will the UNI/USD trade activities remain inactive below $6 for some more time?
The UNI/USD trade activities may have to remain to maintain some levels constituting inactiveness underneath the $6 for some time as the crypto market prices lower below the value line in question. In the wake of that assumption generating positive responses, buyers have to be on the lookout for any possible upswing from an attempt that can be in the market moving back from the baseline before launching a longing order afterward.
On the downside of the technical analysis, the 14-day SMA trend line has slightly moved southbound against the $6 level to create a closure contact in response to the current lower-trading spot where the price is trading. Due to the smaller SMA’s proximity to the $5 support level, it might not be technically feasible for those who take short positions to execute a sell order around it.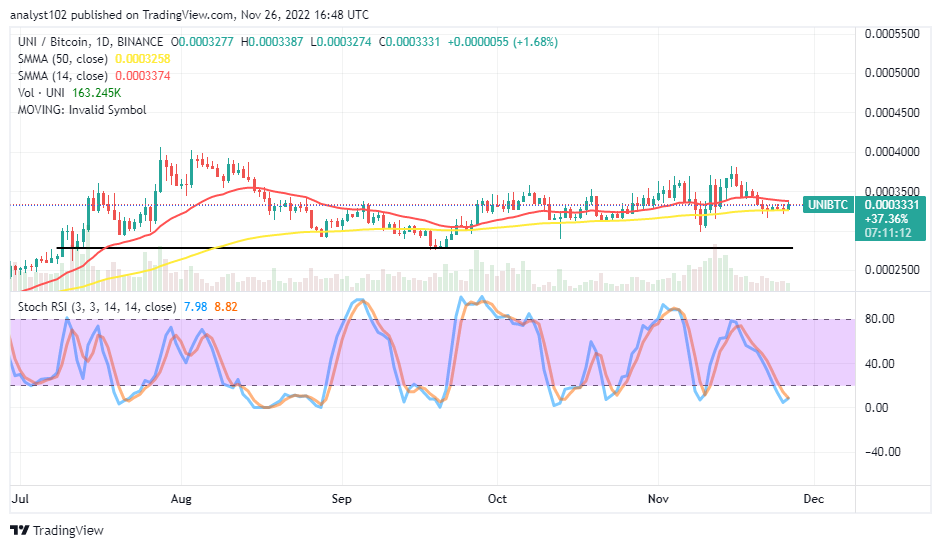
UNI/BTC Price Analysis
In comparison, Uniswap market prices lower below the bigger SMA trend line on the daily price analysis chart. The 14-day SMA indicator is slowly trending eastward closely over the 50-day SMA indicator, showing that the pairing crypto market also features a sideways pattern around the values of the trading tools. The Stochastic Oscillators have dipped into the oversold region, trying to cross their lines back northbound at 7.98 and 8.82 levels. Expectation shows that the base crypto is preparing to stop debasing further longer than necessary against the counter-trading crypto.
Note: Cryptosignals.org is not a financial advisor. Do your research before investing your funds in any financial asset or presented product or event. We are not responsible for your investing results.
You can purchase Lucky Block here. Buy LBLOCK