Dogecoin (DOGE) Price Prediction: DOGE/USDT Now Hovers Above 9-Day EMA
Estimated Reading Time: 3 minutes
Don’t invest unless you’re prepared to lose all the money you invest. This is a high-risk investment and you are unlikely to be protected if something goes wrong. Take 2 minutes to learn more

Dogecoin (DOGE) Price Prediction – June 30, 2025
The Dogecoin market appears to be recovering after previously trading below key technical levels. Although the ongoing sessions do not seem to be yielding significant gains yet, there are indications that support the possibility of short-term upward movement. More details are provided below.
DOGE/USDT Long-Term Trend: Bearish (Daily Chart)
Key Price Levels:
Resistance: $0.1700, $0.2000, $0.2250
Support: $0.1600, $0.1350, $0.1100
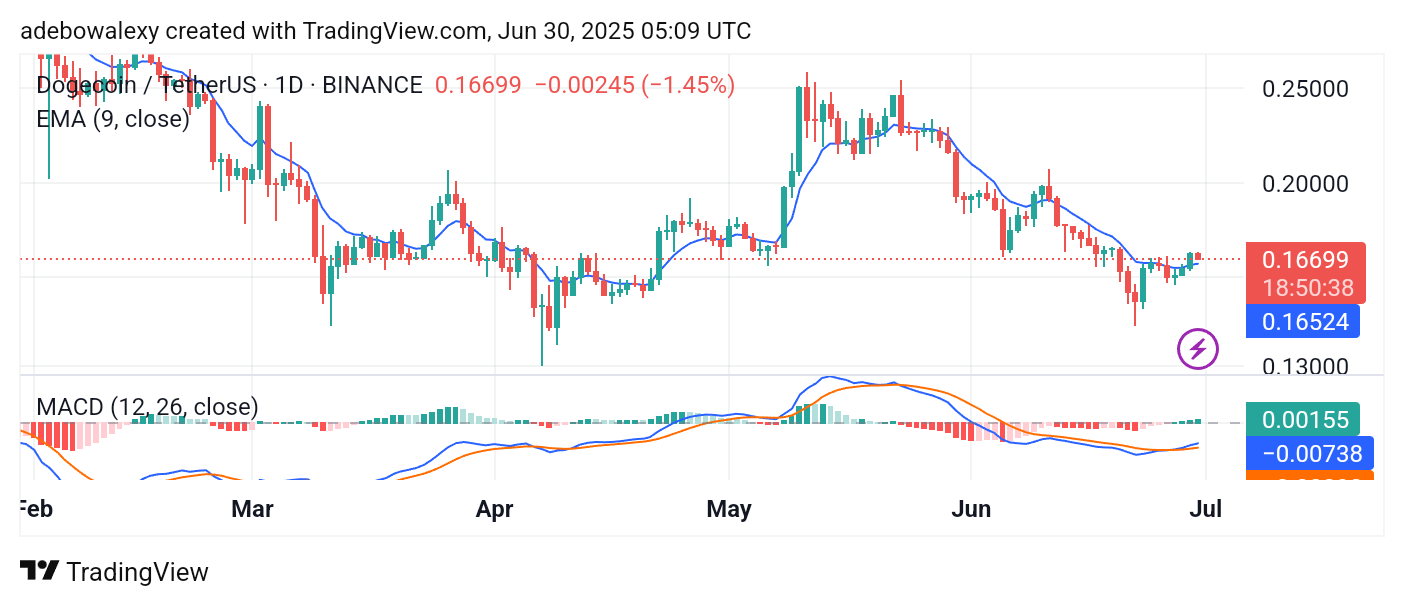
Price activity in the Dogecoin daily market has recently shown a modest recovery. The price rebounded from below the $0.1500 level and is now trading near the $0.1700 resistance level. It currently stands above the 9-day Exponential Moving Average (EMA) line.
Additionally, the Moving Average Convergence Divergence (MACD) lines recently formed a bullish crossover below the equilibrium level, and the MACD lines are steadily trending upward. The indicator’s histogram bars are also growing progressively taller above the equilibrium level, which reinforces the bullish sentiment.
Dogecoin (DOGE) Price Prediction: DOGE/USDT Faces Instant Rejection
Price action in the Dogecoin market rose above the critical technical level at the 9-day EMA line during the previous session, testing resistance at $0.1700. However, the current session shows that bearish pressure is opposing this upward movement.
Despite the appearance of the last price candle, the MACD lines continue to trend slightly upward. Similarly, the histogram bars remain above the equilibrium level, suggesting that bullish momentum is still present.
Dogecoin (DOGE) Price Prediction: DOGE/USDT Maintains Support (4-Hour Chart)
On the 4-hour chart, Dogecoin has experienced a downward retracement for two consecutive sessions. However, trading activity remains above the 9-day EMA line.
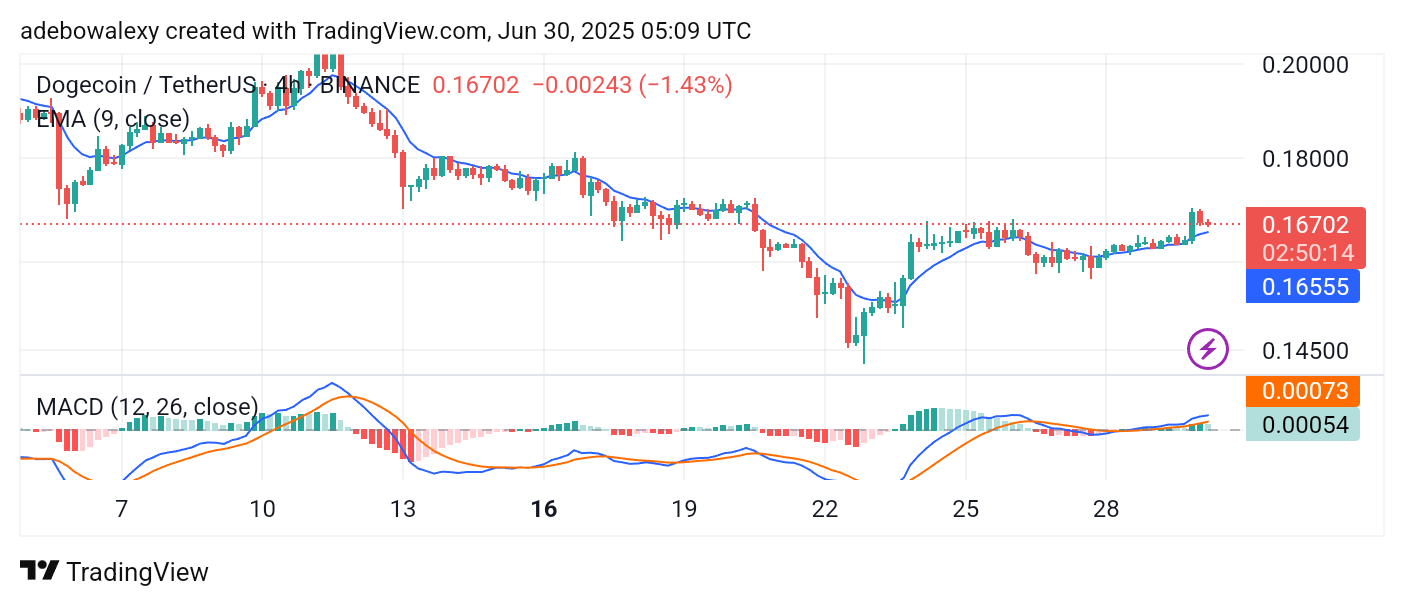
Notably, comparing the size of the previous price candle to the latest one indicates that bearish momentum may be slowing. At the same time, the MACD lines continue to hover above the equilibrium level, and the histogram bars remain elevated. This suggests the potential for a bullish rebound toward the $0.1800 level in the short term..