Ethereum Breaks Into a Bullish Trend Zone, Targets $3,200 High
Estimated Reading Time: 2 minutes
Don’t invest unless you’re prepared to lose all the money you invest. This is a high-risk investment and you are unlikely to be protected if something goes wrong. Take 2 minutes to learn more

Free Crypto Signals Channel
Ethereum Price Long-Term Analysis: Bearish
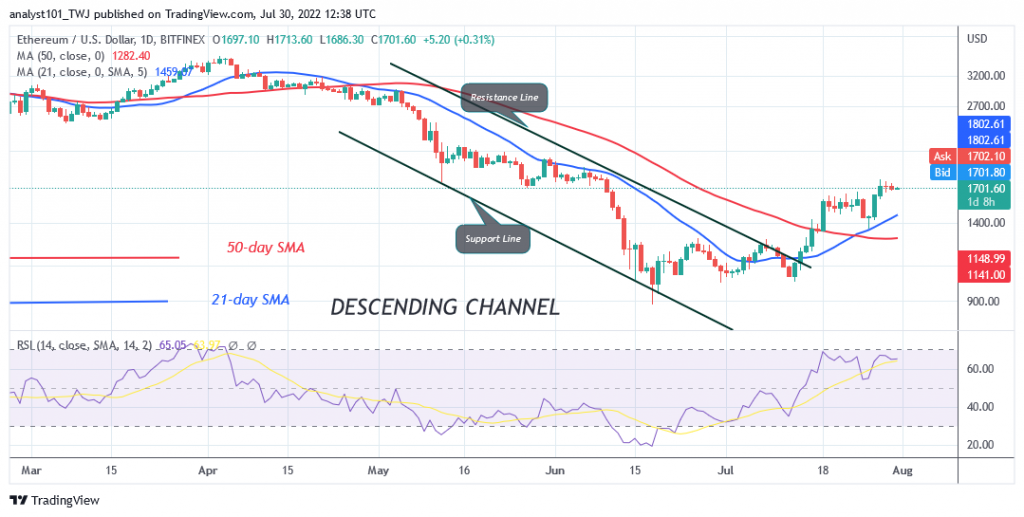
Ethereum’s (ETH) price is in a downward correction as it targets $3,200 high. The largest cryptocurrency will be out of downward correction if buyers keep the price above moving averages. Ether will rise and retest the resistance at $3,000 and $3,200. On the other hand, if the largest cryptocurrency turns from the moving averages, Ether will fall and break below the current support. Ether will further decline to $2,159 low. Today, buyers are at the point of breaking above the moving averages. This implies that the selling pressure has subsided. Ether is now trading at $2,794 at the time of writing.
Ethereum Indicator Analysis
The recent bullish move has pushed Ether to level 53 of the Relative Strength Index for period 14. It implies the altcoin is trading in the bullish trend zone and capable of a further upward move. Ether is above the 80% range of the daily stochastic. The market has reached the overbought region. The current uptrend may face rejection as sellers emerge in the overbought region of the market.
Technical indicators:
Major Resistance Levels – $2, 600, $2,800, $3,000
Major Support Levels – $1.500, $1, 300, $1,100
What Is the Next Direction for Ethereum?
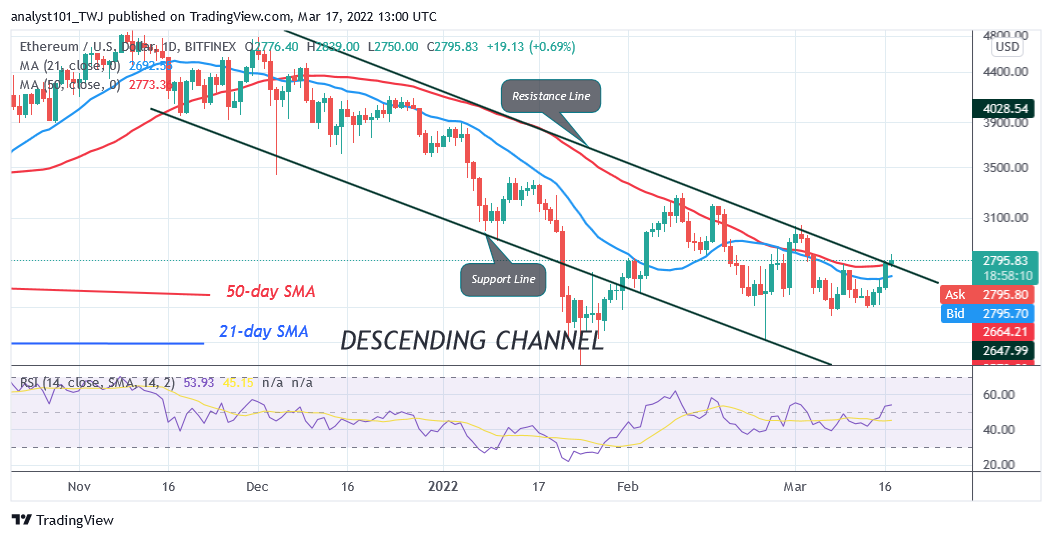
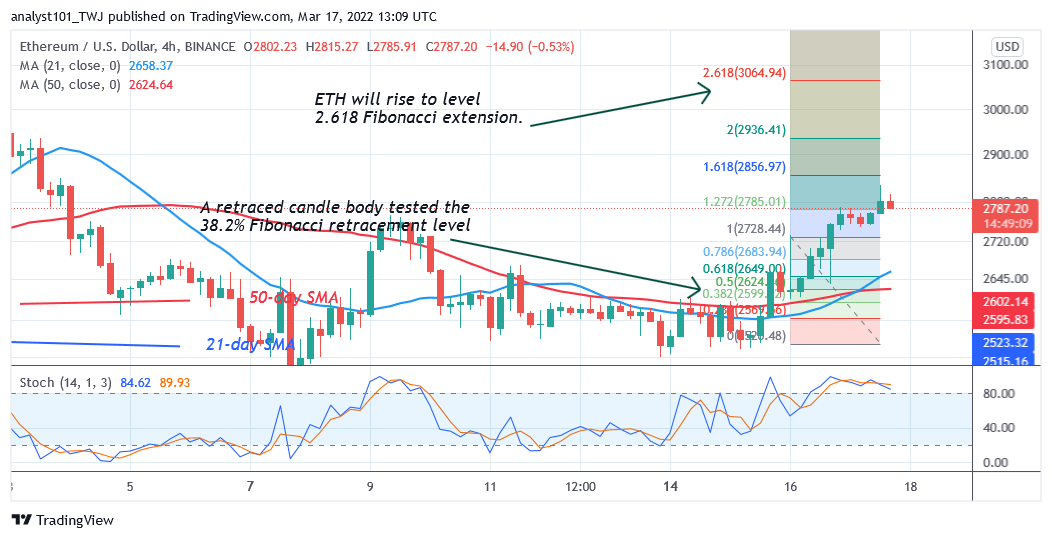
On the 4-hour chart, Ethereum is in an upward move as it targets $3,200 high. Ether is now trading in the overbought region. Meanwhile, on March 16 uptrend; a retraced candle body tested the 38.2% Fibonacci retracement level. The retracement indicates that ETH will rise to a level 2.618 Fibonacci extension or $3,064.94.
You can crypto coins here. Buy LBlock
Note: Cryptosignals.org is not a financial advisor. Do your research before investing your funds in any financial asset or presented product or event. We are not responsible for your investing results