Solana (SOL/USD) Price Is Surging High
Estimated Reading Time: 3 minutes
Don’t invest unless you’re prepared to lose all the money you invest. This is a high-risk investment and you are unlikely to be protected if something goes wrong. Take 2 minutes to learn more
Solana Price Prediction – April 28
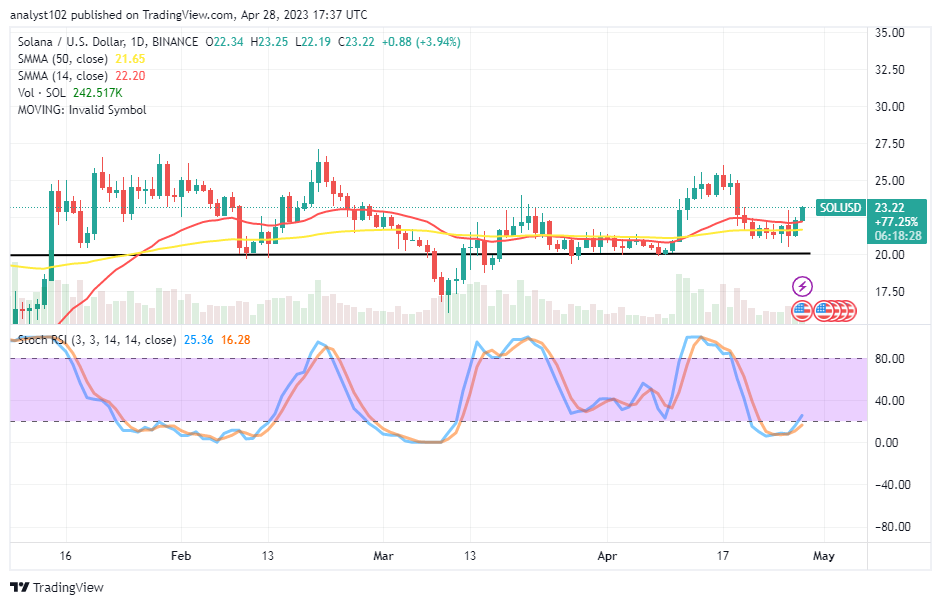
The Solana market has been surging high after a declining force complete in a range-bound moving mode around the points of $22 and $21. Price has been bargaining between the high and the low-value points of $23.25 and $22.19 at an average of 3.94 percent positive. Instant buy orders can launch safely alongside the current uprising force.
SOL/USD Market
Resistance levels: $25, $27.50, $30
Support levels: $17.50, $15, $12.50
SOL/USD – Daily Chart
The SOL/USD daily chart reveals the crypto-economic price is surging high through resistances over the points of the SMA trend lines. The 50-day SMA trend line is at $21.65, underneath the $22.20 value line of the 14-day SMA. The combination of the indicators’ postures contributed to the aftermath baseline. The Stochastic Oscillators have crossed northbound from the oversold region to keep 16.28 and 25.36 levels.
Would the SOL/USD market sustain the condition of surging high, breaking through overhead barriers?
The SOL/USD markets will likely hold their positions steady, breaking through some resistances above the trend lines of the SMAs as the crypto-economic price is surging high. Long-position players would have to play alongside the present increasing mode onto the resistances of the $25 for other rounds of pit stops. However, if the Stochastic Oscillators remain northbound-crossing when the price tends to reach the value line, some ups will surface beyond it.
On the downside of the technical analysis, at this moment, sellers intending to push against the established rising pressures should think twice. An overbought reading situation has to materialize and back with the emergence of a bearish trading candlestick before starting to launch a shorting order.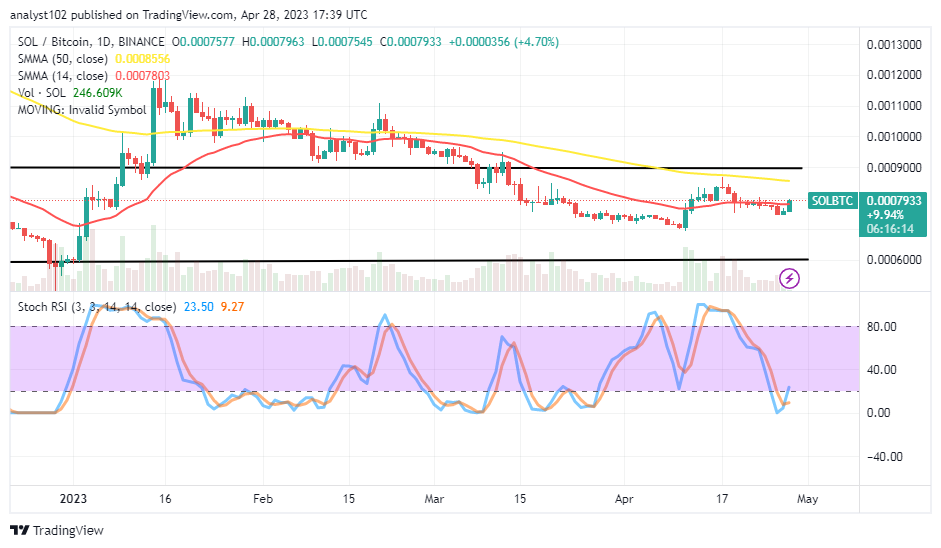
SOL/BTC Price Analysis
Contrasting the trending capability between Solana and Bitcoin, on the price analysis chart, showcases the former crypto is surging high in its valuation against the latter. The 14-day SMA indicator is underneath the 50-day SMA indicator. The Stochastic Oscillators are at 9.27 and 23.50 levels. That provides information about a current increase. It should underline that the purchasing power of the base crypto will win out over-the-counter cryptocurrency.
Note: Cryptosignals.org is not a financial advisor. Do your research before investing your funds in any financial asset or presented product or event. We are not responsible for your investing results.
You can purchase Lucky Block here. Buy LBLOCK