Polygon (MATIC/USD) Market Continues to Build Support at $0.70
Estimated Reading Time: 3 minutes
Don’t invest unless you’re prepared to lose all the money you invest. This is a high-risk investment and you are unlikely to be protected if something goes wrong. Take 2 minutes to learn more

Free Crypto Signals Channel
Polygon Price Prediction – September 25
The seller’s force is seemingly exhausted at a lower-trading spot of $0.70. And the crypto market continues to build support around the value line as it trades at $0.756 at the minute positive percentage rate of 0.40.
MATIC/USD Market
Key Levels
Resistance levels: $0.90, $1, $1.10
Support levels: $0.65, $0.60, $0.55
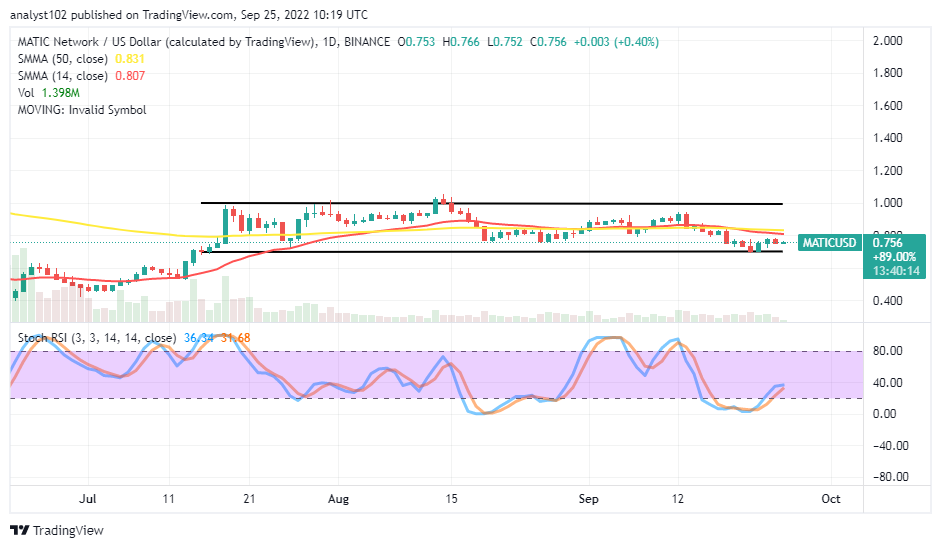
MATIC/USD – Daily Chart
The MATIC/USD daily chart reveals the crypto-economic market continues to build support at the $0.70 level. The 14-day SMA trend line has briefly gone to the south side, breaking the 50-day SMA trend line. And they give close value points at $0.807 and $0.831. It noticed that the market is systemically trading in range-bound zones covering logical points of the value lines mentioned earlier, the $0.80, $0.90, and $1 levels. The Stochastic Oscillators have sprung northbound from the oversold region to get closely below the range of 40. And they are around 36.34 and 31.68 range values.
At what approximate percentage rate will the MATIC/USD trade push the downside from its current point?
The approximate percentage rate the MATIC/USD trade can push to the downside appears to be about 30% from its current trading point as the crypto market continues to build support at the $0.70 level. Bulls possess the possibility of running low underneath the trend lines of the SMAs for some time before regaining the momentum to swing up high afterward. As a result of that sentiment, longing orders can profitably execute while price pulls down in fakery moving mode that almost immediately give in back to an upward reversal motion.
On the downside of the technical analysis, if the Stochastic Oscillators swerve their lines opened in the near term, the price tends to move northwardly through the barrier points of the SMA trend lines to a large extent. Nevertheless, in the long or medium term, buying capacity is likely confined within the range points involving the $1 and $0.70 levels. It appears not technically inclined to follow a breakdown motion around the lower-trading zone afterward to avoid the risk a rebounding move can cause at that spot.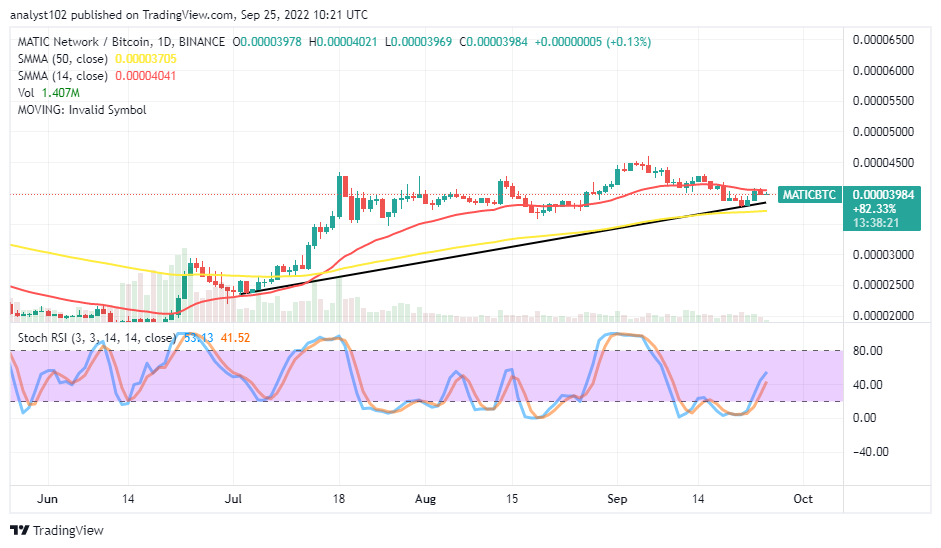
MATIC/BTC Price Analysis
Polygon, to a greater extent, has been pushing northwardly against the trending ability of Bitcoin. The cryptocurrency pair market continues to build support around the trend line of the smaller SMA. The 50-day SMA indicator is underneath the 14-day SMA indicator. And they are more pointing to the north than the east to indicate that a chain of range moves also plays alongside the pairing crypto instrument. The Stochastic Oscillators have crossed northbound from the oversold region to reach 41.52 and 53.13 range values. There still be the need for the base crypto to rebuild its energy from a lower zone before pushing against its counter-trading crypto.
Note: Cryptosignals.org is not a financial advisor. Do your research before investing your funds in any financial asset or presented product or event. We are not responsible for your investing results.
You can purchase Lucky Block here. Buy LBLOCK