POL (prev. MATIC) Price Prediction: POL/USDT Keeps Floating Above the $0.1700 Price Level
Estimated Reading Time: 3 minutes
Don’t invest unless you’re prepared to lose all the money you invest. This is a high-risk investment and you are unlikely to be protected if something goes wrong. Take 2 minutes to learn more

POL (prev. MATIC) Price Prediction: June 28, 2025
The POL (prev. MATIC) daily market continues to lack the momentum to attract much attention. Price activity can be seen lingering around important technical levels. However, recent price candles have appeared green, suggesting some minimal gains. Yet, the overall outlook for this market remains unconvincing.
POL/USDT Long-Term Trend: Bearish (Daily Chart)
Key Price Levels:
Resistance: $0.1900, $0.2100, $0.2300
Support: $0.1700, $0.1500, $0.1300
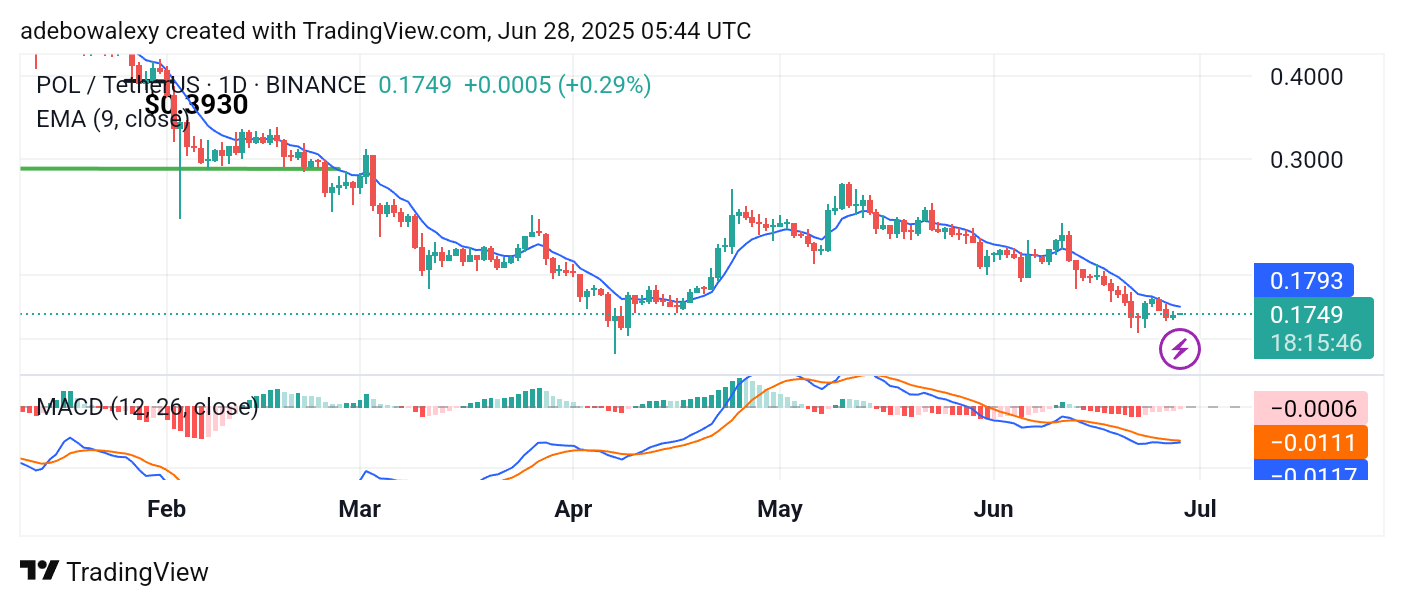
Since the previous session in the POL (prev. MATIC) , price candles have mostly appeared green. However, the last price candle on this chart is dashed in shape, though still green. It has formed below the 9-day Exponential Moving Average (EMA) line. Meanwhile, the Moving Average Convergence Divergence (MACD) lines remain below the equilibrium level and continue to trend sideways. The histogram bars of the indicator are pale red, indicating that downward pressure is beginning to weaken.
POL (prev. MATIC) Price Prediction: POL/USDT Market Requires More Catalysts
All current indicators from the POL (prev. MATIC) market suggest that it lacks a significant push in either direction. The last two price candles have only slightly lifted the market toward the 9-day EMA line. Nevertheless, price action still remains below this technical landmark as of the time of writing, which continues to limit bullish sentiment.
Similarly, the appearance of the MACD histogram bars suggests that downward forces may be losing their grip. As such, this may allow for at least some additional minimal gains in the short term.
POL (prev. MATIC) Price Prediction: POL/USDT Bulls Keep Lurking (4-Hour Chart)
By examining the POL (prev. MATIC) market on a 4-hour chart, one can see that price action remains on a bullish path, as shown by the recent green candle appearing above the 9-day EMA line.
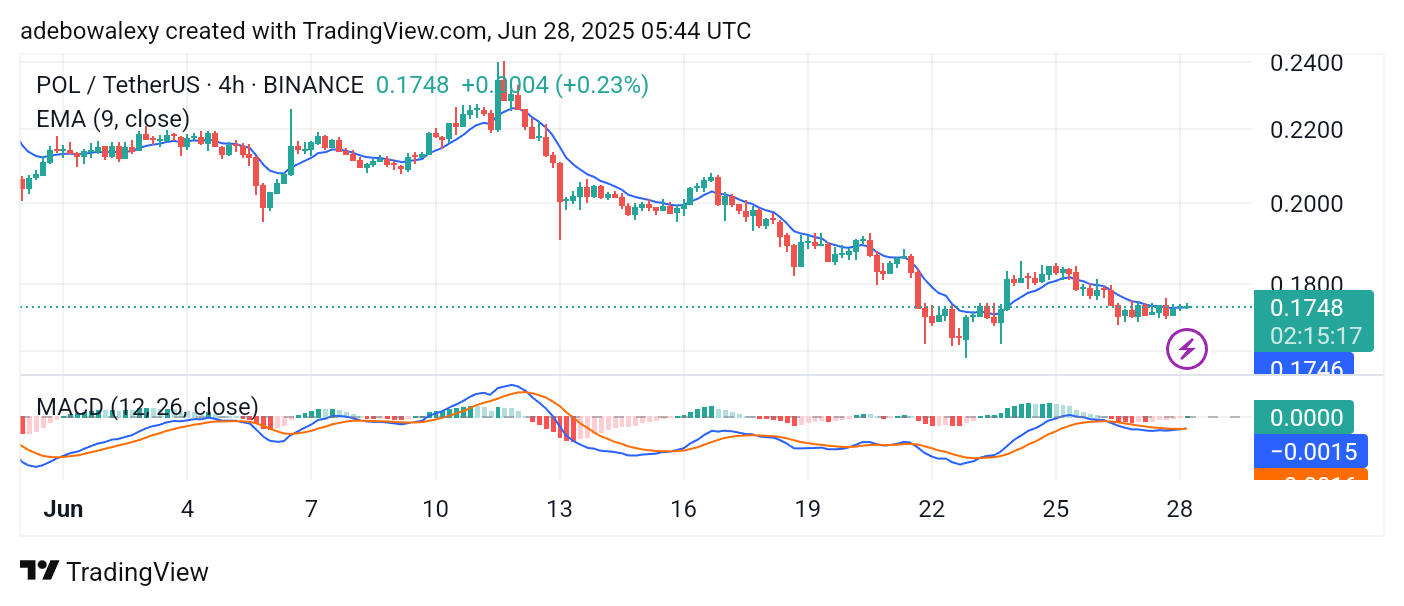
Additionally, the MACD indicator lines are already converging below the equilibrium level, while the terminals of the indicator are oriented upward toward the equilibrium level. Consequently, upside sentiment appears to be improving. However, due to the lack of significant price movement, traders may want to stay cautious and aim for only modest gains toward the $0.1800 price level.