Litecoin (LTC/USD) Trade Experiences Abnormal Breakout
Estimated Reading Time: 3 minutes
Don’t invest unless you’re prepared to lose all the money you invest. This is a high-risk investment and you are unlikely to be protected if something goes wrong. Take 2 minutes to learn more
Litecoin Price Prediction – September 14
The LTC/USD trade experiences an abnormal breakout in its crypto-economic price valuation. The abnormality took place yesterday, close to the main resistance level at $250. The market’s percentage is rated at about 3.84 as price trades around the line of $186. That implies that the market seems to push for an increase.
LTC/USD Market
Key Levels:
Resistance levels: $240, $280, $320
Support levels: $160, $140, $120
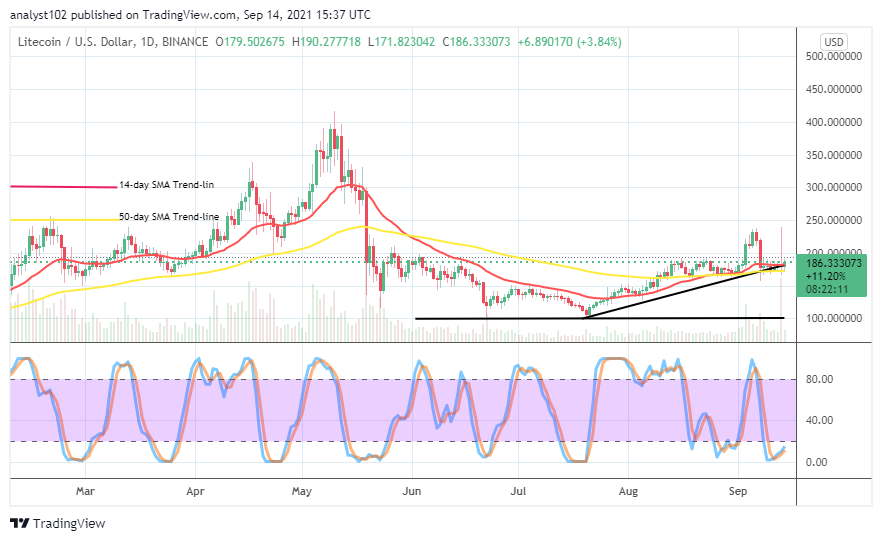
LTC/USD – Daily Chart
The LTC/USD daily chart showcases that the crypto trade experiences an abnormal breakout recently. A candlestick violently emerged northwardly yesterday but, in no time, revised downward back into its lower trading zones between $200 and $150 on the same day. The 14-day SMA abdicator is closely above the 50-day SMA indicator. The bullish trend line drew to support the smaller SMA trend line. The Stochastic Oscillators are in the oversold region, attempt pointing to the northbound.
Would the market continue ranging, more in $200 and $150 levels as the trade experiences an abnormal breakout?
A full-body formation of either bearish or bullish candlestick needed to emerge outside the range lines of $200 and $150 so that the potential stable direction of the LTC/USD price could determine as the trade experiences an abnormal breakout. There can be a slow-motion of variant downs to the lower value line before bulls could swing up more decently to touch around the upper range line in a bit to prolong the ranging movements.
On the downside, the LTC/USD market bears may have to build upon any active price motion, having a fearful-running southward at a particular point in time. However, there is an indication that not quite a safe trading situation to the subsequent declines beneath the lower range value line. Strong support baselines are most likely to build up around the $150 in a slow and steady-moving manner that may cause a trap for bears.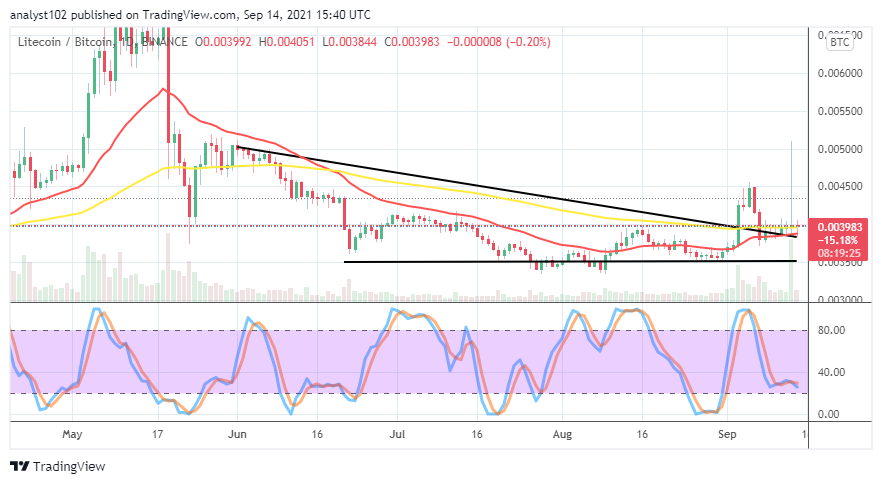
LTC/BTC Price Analysis
In comparison, there is a sign on the LTC/BTC price analysis chart that the crypto pair trade experiences an abnormal break out suddenly. In no time, during yesterday’s session, the sudden aggressive breakout was reverted to its zones of trading. The 50-day SMA trend line is above the 14-day SMA trend line. The Stochastic Oscillators have conjoined the lines closely over range 20, seemingly trying to bend southbound against it. That suggests that the base crypto may still witness some downs as paired with the counter crypto.
Note: Cryptosignals.org is not a financial advisor. Do your research before investing your funds in any financial asset or presented product or event. We are not responsible for your investing results.
You can purchase crypto coins here. Buy Tokens