Dogecoin (DOGE/USD) Market Activity Is Set to a Depression Level of $0.075
Estimated Reading Time: 3 minutes
Don’t invest unless you’re prepared to lose all the money you invest. This is a high-risk investment and you are unlikely to be protected if something goes wrong. Take 2 minutes to learn more
Dogecoin Price Prediction – May 29
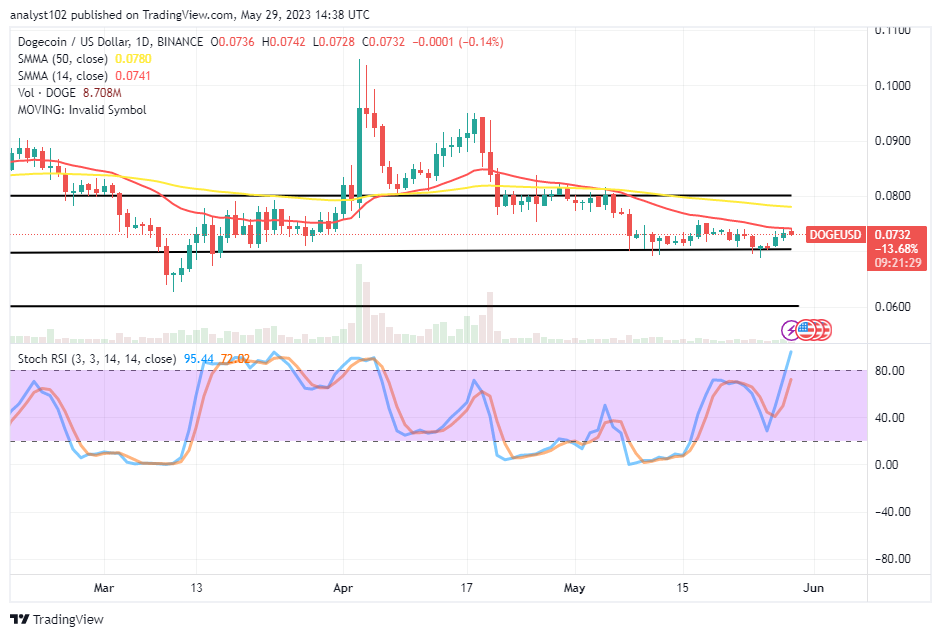
The DOGE/USD market activity to a depression level of $0.075 after hitting a resistance trading spot beneath the overhead barrier line at $0.080. With a minute percentage rate of 0.14, buying and selling capacity has been slowly between $0.0742 and $0.0728. The trading cycle that is currently observable serves as an indicator of when there will be less activity.
DOGE/USD Market
Key Levels:
Resistance levels: $0.080, $0.085, $0.090
Support levels: $0.065, $0.060, $0.055
DOGE/USD – Daily Chart
The DOGE/USD daily chart shows the crypto-economic market activity sets to a depression level of $0.075, around the trend line of the smaller indicator. Underneath the 50-day SMA indication is the 14-day SMA indicator. Around the $0.080 resistance line, the larger trend line is prepared to establish a backing position. The Stochastic Oscillators are in the direction of the north at 72.02 and 95.44, and a smaller selling candlestick is about to form to serve as a warning signal.
Does the DOGE/USD market’s current trading capacity indicate that momentum will remain over $0.65?
There has been a regaining of a stance around the $0.070 following a decline that featured, in an attempt to move past it, given that the DOGE/USD market activity sets to a depression level of $0.075. That assumption has fished out based on the path the price has kept over time to the downside. In the real-time trade approach, moments of buying have better window opportunities to remain to hold longing traits.
As regards the devaluation of the DOGE/USD technical analysis, it suggested that sellers may need to hold back from carrying out any other 14-day SMA’s point. It demonstrated that some increases are rapidly approaching their maximal weight during the reading phase of the stochastic oscillators. If the market turns around once more and hovers around the $0.070 mark, it will do so to restore confidence in the resurgence of positive forces.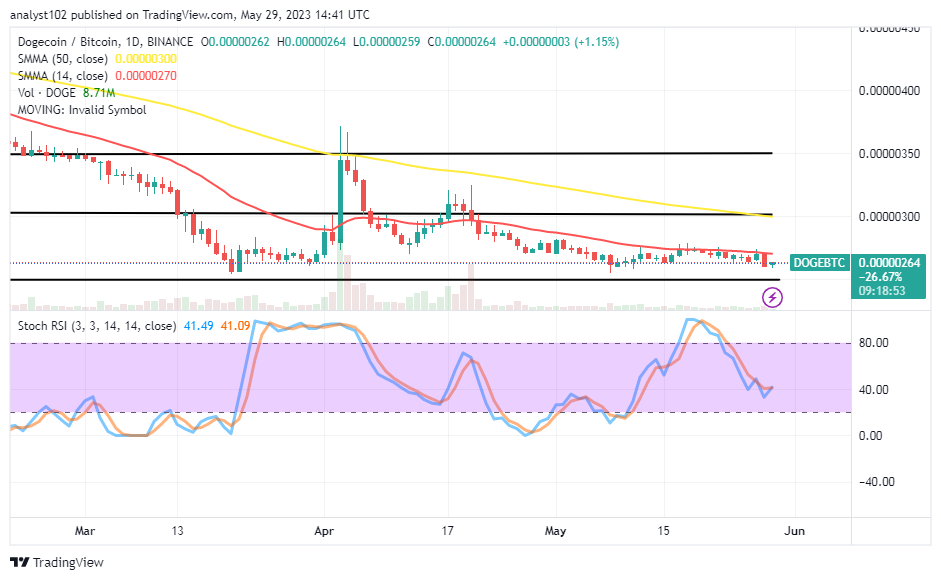
DOGE/BTC Price Analysis
In comparison, it has been that the Dogecocoin market operation remains set to a depression level of the smaller indicator’s trend line. In front of the 50-day SMA trend line is the 14-day SMA trend line. The Stochastic Oscillators are positioned southbound from the overbought region to 40. And they are between 41.09 to 41.49A. As a result, the base cryptocurrency is failing to gain ground on its counter-crypto company.
Note: Cryptosignals.org is not a financial advisor. Do your research before investing your funds in any financial asset or presented product or event. We are not responsible for your investing results.
You can purchase Lucky Block here. Buy LBLOCK