Tamadoge (TAMA/USD) Bulls Maintain Hope Amid Persistent Bearish Pressure
Estimated Reading Time: 3 minutes
Don’t invest unless you’re prepared to lose all the money you invest. This is a high-risk investment and you are unlikely to be protected if something goes wrong. Take 2 minutes to learn more
Despite sustained bearish momentum, Tamadoge (TAMA/USD) continues to hold firmly above the psychologically important $0.0001 support level. Multiple rejections at this price point underscore the determination of bulls to defend the zone and hint at underlying buying interest.
This key level has increasingly become a stronghold for bullish sentiment, with buyers regrouping each time the market tests it. The inability of bears to push the price decisively below $0.0001 suggests a loss of downside momentum. Current price consolidation around this area may indicate accumulation, potentially setting the stage for a bullish breakout—should demand begin to rise.
Key Levels to Watch
- Resistance Zones: $0.00045, $0.00050, $0.00055
- Support Zones: $0.00010, $0.00009, $0.00008
Tamadoge (TAMA/USD) Consolidates Near $0.0001 as Bulls Defend Key Support
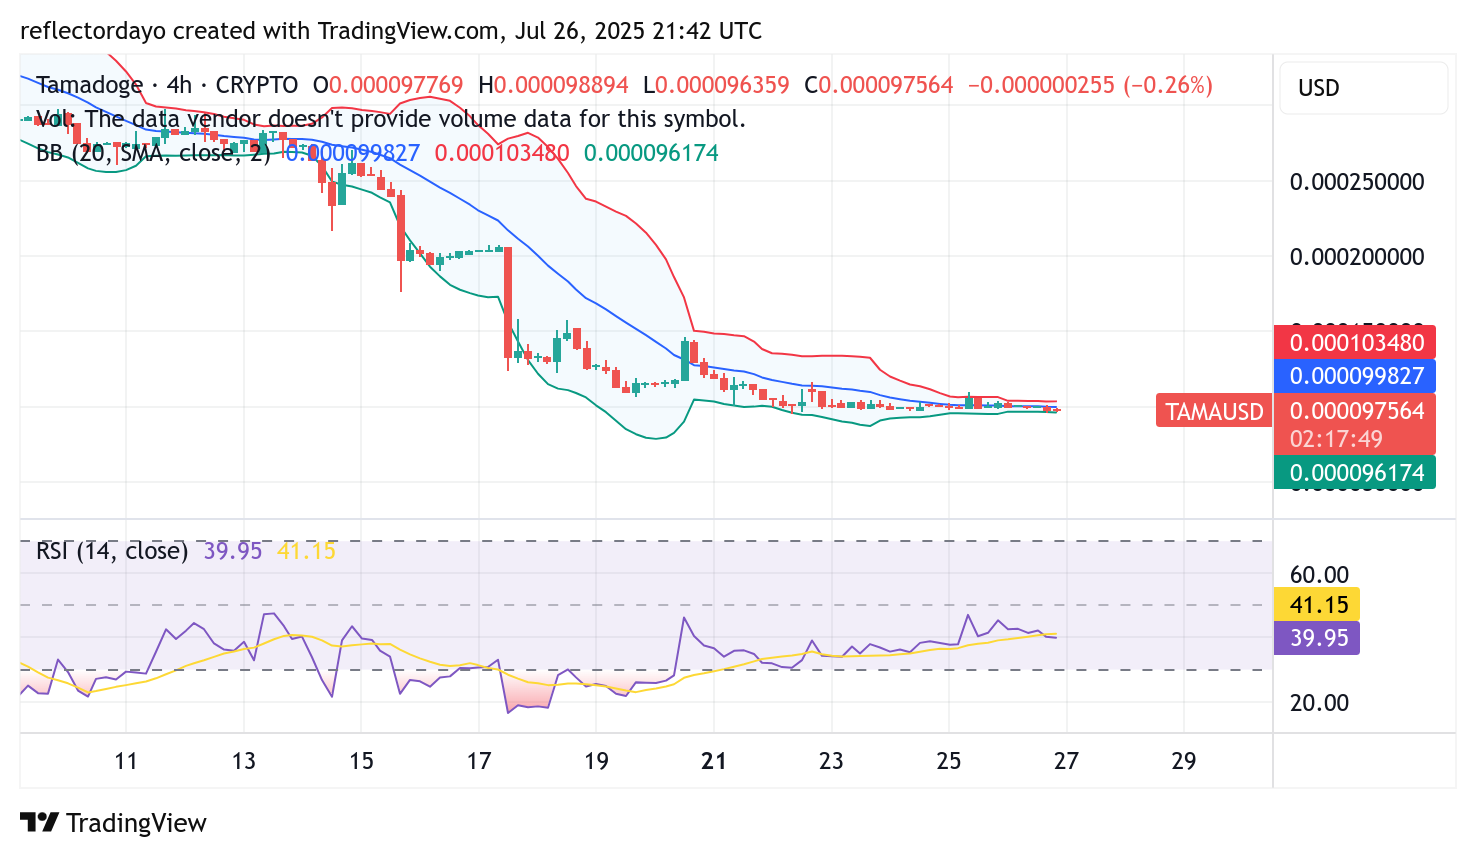
Following a rebound from oversold conditions—confirmed by the Relative Strength Index (RSI)—Tamadoge (TAMA/USD) has struggled to sustain its bullish momentum. The recovery failed to push the price back to the midpoint (50 level) of the RSI, often considered the equilibrium zone. With the RSI currently hovering around 39, bearish sentiment remains dominant, signaling continued selling pressure.
Notably, the RSI line is now moving sideways, reflecting indecision and consolidation in market momentum. Meanwhile, the Bollinger Bands have begun to narrow around the flat price channel, indicating reduced volatility and a potential buildup for a breakout. This tightening range could foreshadow an imminent directional move—possibly to the upside.
Traders should stay alert, as the technical setup suggests that the market may be preparing for a more decisive shift in price action.
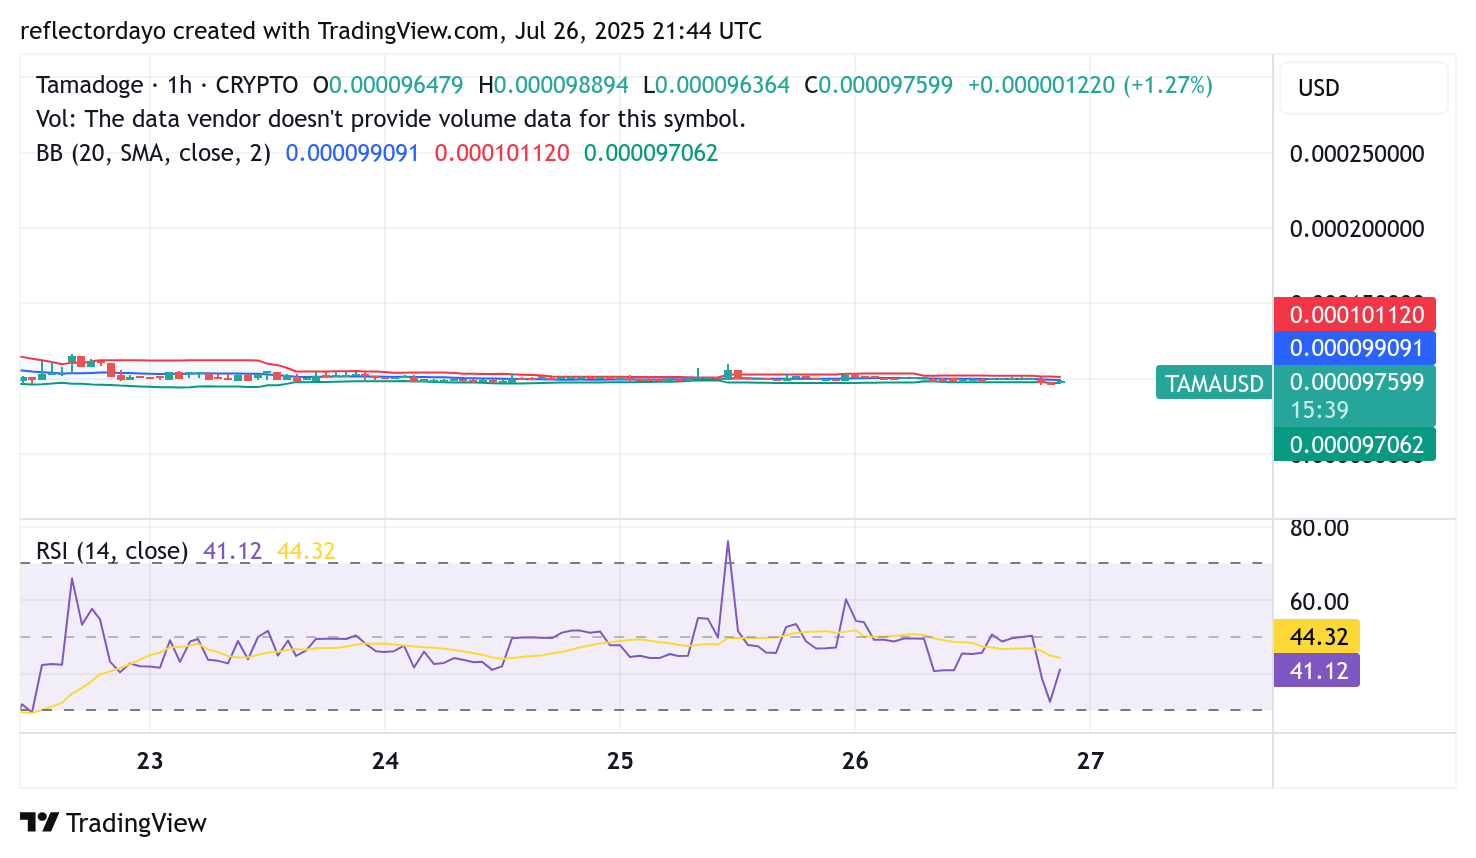
TAMA/USD 1-Hour Chart: Strengthening Bullish Bias as Key Support Zone Remains Intact
The 1-hour timeframe shows TAMA/USD trading in a tight consolidation band just above the crucial $0.0001 level. While this sideways movement reflects short-term indecision, it may also signal underlying bullish accumulation. Supporting this view is a gradual rise in the Relative Strength Index (RSI), which currently sits at 47—approaching neutral territory. This subtle momentum shift hints at a potential upward breakout, with the next key resistance target positioned around $0.00015.
Buy Tamadoge!
There’s no mobile runner out there quite like #TamadogePursuit! 🏃♂️
1️⃣ Sign up – start with 20 free credits for a boost!
2️⃣ Climb up the leaderboards.
3️⃣ Win $TAMA rewards!Play Now! 👇
📱Android: https://t.co/Of8SYALRzL
📱 iOS: https://t.co/IthvqovwAH pic.twitter.com/84HNqob9Rf— TAMADOGE (@Tamadogecoin) September 10, 2024