Bitcoin Cash (BCH/USD) Depresses Values at $600
Estimated Reading Time: 3 minutes
Don’t invest unless you’re prepared to lose all the money you invest. This is a high-risk investment and you are unlikely to be protected if something goes wrong. Take 2 minutes to learn more
Bitcoin Cash Price Prediction – July 2
Lately, the trading activity pairing BTC with the USD currently depresses values underneath the level of $600 to trade around the value of $480 at a percentage rate of about -3.17.
BCH/USD Market
Key Levels:
Resistance levels: $600, $800, $1,000
Support levels: $400, $300, $200
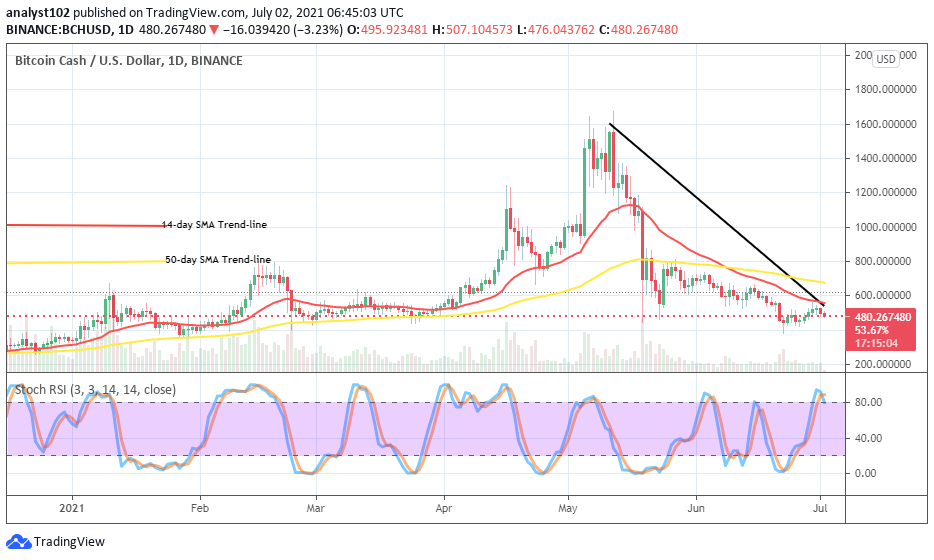
BCH/USD – Daily Chart
On the BCH/USD daily chart, the crypto economy now slightly depresses values underneath the market’s line of $600 while price hit resistance close below it. The smaller SMA has joined with the bearish trend-line at the last end, pointing toward the south. The 50-day SMA indicator is over the 14-day SMA trend-line. The Stochastic Oscillators are in the overbought region with a southbound-crossing style of the lines to attest to an ongoing depressive motion in the crypto trading operation.
Will the BCH/USD market depress values more visibly in the business dealings?
Technically, it now appears that the BCH/USD market dealings may still push on a lighter note southward, probably until a lower value achieved around the level of $400 in the subsequent sessions. In the wake of that assumption, bulls may have to reposition their presence in this market by being on the lookout for a sudden emergence of a bullish candlestick signaling a northward movement’s eturn before considering joining the motion. In the meantime, investors could now come in as it now appears that this is one of the best buying periods.
On the downside, as the market’s valuation hit resistance around the smaller SMA trend-line, depression in price tends to feature furthermore in a less active-moving manner. And, the lower value of $400 could likely be the extent to which the crypto market could go of the BCH/USD bears in the long run. The market level around $600 may remain the actual decent spot that bears get an entry for the time being.
BCH/BTC Price Analysis
In comparison, the BCH/BTC price analysis chart shows that the base crypto is on the verge of depressing the trending capacity pairing with the flagship counter crypto in the next trading session. The crossing of the lines by the Stochastic Oscillators in the overbought region has attested to that sentiment. Also, the freshly crossing of the 50-day SMA indicator by the 14-day SMA trend-line to the south signals in support of that as the bearish trend-line drew downward across them at the tail end. All the indicators’ readings state that Bitcoin Cash will potentially lose more trending directions to Bitcoin. And, it could be in a slow and steady-moving manner.
Note: new.cryptosignals.org is not a financial advisor. Do your research before investing your funds in any financial asset or presented product or event. We are not responsible for your investing results.
You can purchase crypto coins here. Buy Tokens