Solana (SOL/USD) Market Maintains a Decline at $10
Estimated Reading Time: 3 minutes
Don’t invest unless you’re prepared to lose all the money you invest. This is a high-risk investment and you are unlikely to be protected if something goes wrong. Take 2 minutes to learn more
Solana Price Prediction – December 30
There has been a continuation in the weight of left-over sell-off pressures, dominating the pace in the SOL/USD trade as the crypto market maintains a decline around the $10 line. As of writing, activity is at -2.70% between the high and low of $10.24 and $9.29.
SOL/USD Market
Key Levels:
Resistance levels: $12.50, $15, $17.50
Support levels: $7.50, $6.50, $5.50
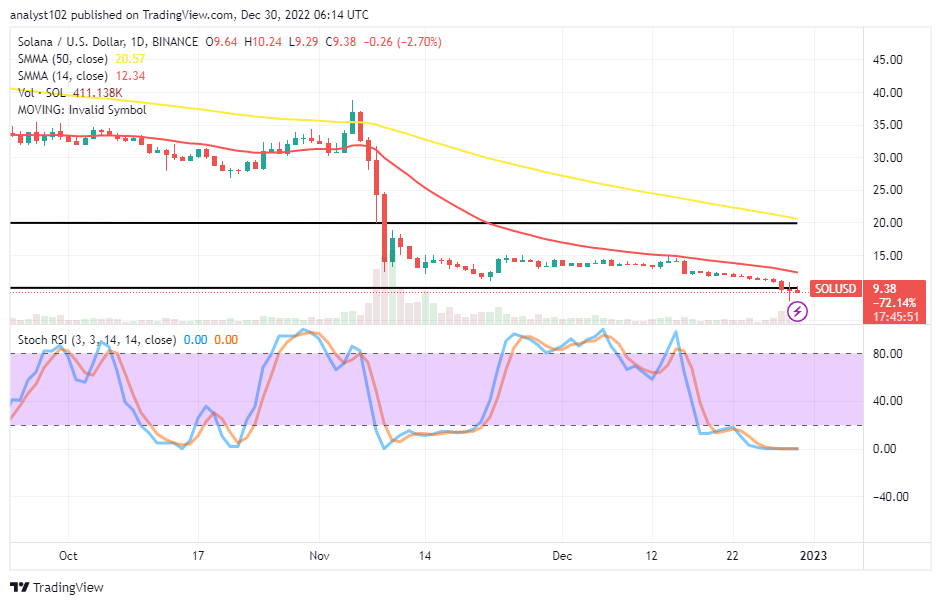
SOL/USD – Daily Chart
The daily chart showcases that the crypto economy market maintains a decline around the $10 level, where a lower horizontal line has been. The 14-day SMA indicator is at $12.34, underneath the $20.57 value point of the 50-day SMA indicator. The Stochastic Oscillators have traveled deep down into the oversold region to touch 0.00 and 0.00 levels. That implies a depression is still on the rise at a maximum capacity.
Has the SOL/USD market activity produced a trustworthy purchasing signal as of writing?
The SOL/USD trade operation is yet to raise a sustainable buying signal as the crypto market maintains a decline around the $10 level. It has been that the Stochastic Oscillators have reached a massive-lower level of bearish-trading weight to suggest long-position placers should brace up to start building-ups in the near time. An attempt by a bullish candlestick to spread northward through the 14-day SMA trend line will generate some more ups in the subsequent sessions.
On the downside of the technical analysis, the movement forces to the south side have been steadily re-occurring in a series with low-active capacity. Currently, the situation has fully deteriorated to the point where decreased trading could produce springs soon. If that assumption has to be abode, sellers should be wary of exerting new shorting orders around the lower horizontal line drawn at $10.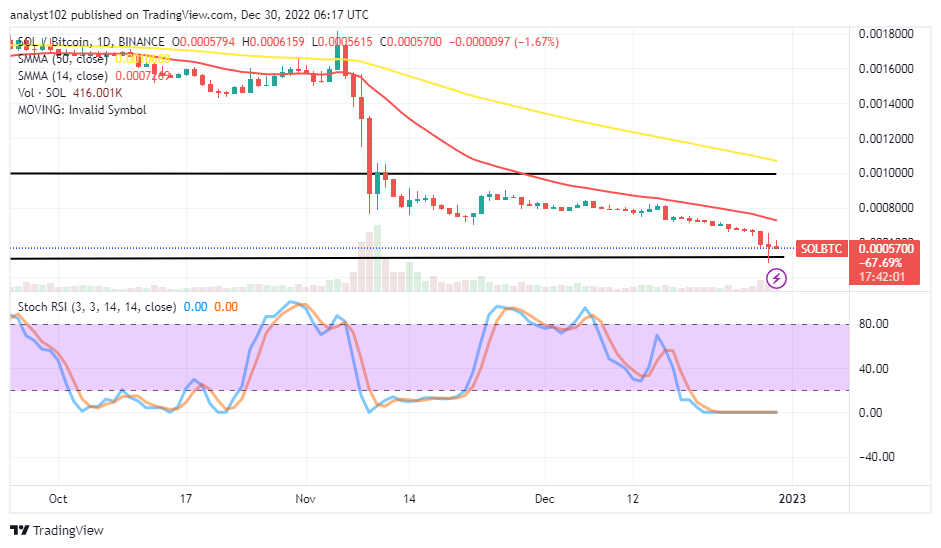
SOL/BTC Price Analysis
In comparison, Solana remains to succumb to a depression inflicted on it by Bitcoin. The lower horizontal line drew to keep abreast of the debasing former crypto. The 14-day SMA indicator has stretched southward beneath the 50-day SMA indicator. The 0.00 and 0.00 levels are by the Stochastic Oscillators’ dip into the oversold region and their consolidation-style movement. Even though a decreasing motion is in progress, it seems that it would be uncomfortable to witness a shorting order entry at this point.
Note: Cryptosignals.org is not a financial advisor. Do your research before investing your funds in any financial asset or presented product or event. We are not responsible for your investing results.
You can purchase Lucky Block here. Buy LBLOCK