Bancor (BNT/USD) Approaches the $0.800 Price Milestone
Estimated Reading Time: 3 minutes
Don’t invest unless you’re prepared to lose all the money you invest. This is a high-risk investment and you are unlikely to be protected if something goes wrong. Take 2 minutes to learn more
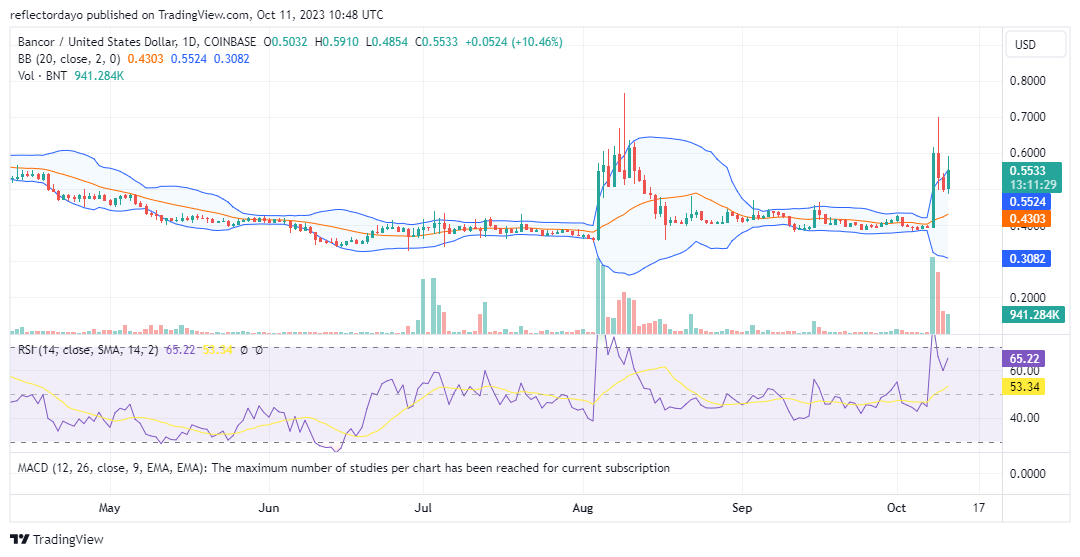
The Bancor market has exhibited a sustained price consolidation trend at approximately $0.400 since mid-August. However, on October 8, a significant surge in the bull market propelled the price to $0.700. As the price reached $0.700, many traders began to take profits. Nevertheless, there are still several bullish traders actively supporting the market, helping to maintain a bullish sentiment even during the price retracement back to $0.500.
Bancor Market Data
- BNT/USD Price Now: $0.561
- BNT/USD Market Cap: $80,327,357
- BNT/USD Circulating Supply: 142,497,388 BNT
- BNT/USD Total Supply: 161,196,921 BNT
- BNT/USD CoinMarketCap Ranking: #261
Key Levels
- Resistance: $0.650, $0.70, and $0.75.
- Support: $0.45, $0.40, and $0.35.
Price Prediction for Bancor: The Indicators’ Point of View
Based on our analysis of the indicators, a significant shift has marked the conclusion of the market’s consolidation phase. This shift commenced on October 8 and was accompanied by a substantial trade volume increase, as evidenced by a robust bullish candlestick and a prominent histogram. The Bancor bullish momentum persisted into the following day, reaching a peak of $0.700. Nevertheless, the market found support at the $0.500 price level, providing an advantage to the bulls for a potential continuation of the upward trend.
It’s essential to consider the descending high pattern that has been forming on the chart since August 9, indicating the growing strength of bears. This descending high pattern may lead to a further decline in prices. However, if the bulls can maintain their solid foothold at the $0.500 support level, another consolidation phase may emerge. Additionally, the diverging lower standard deviation curve is likely to retrace upward, forming a converging, narrowing band around the price action.”
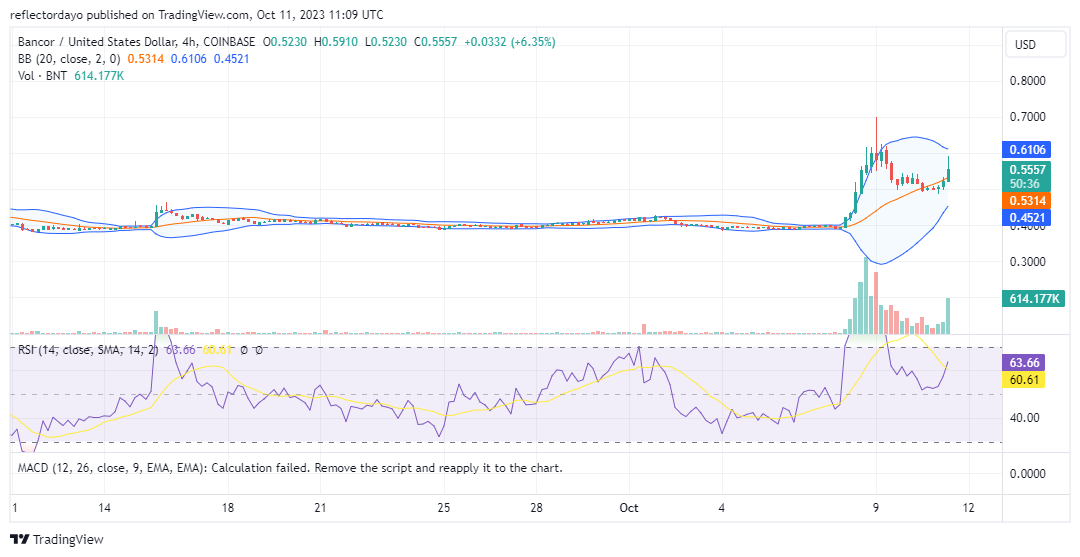
BNT/USD 4-Hour Chart Outlook
The development mentioned in the latter part of the preceding passage is presently unfolding within the 4-hour timeframe. Initially, the Bollinger Bands indicated a substantial divergence between the bands, but as consolidation occurs at the $0.500 price level, the lower standard deviation curve has started to ascend, converging around market activity. Should the market ultimately consolidate at this level, the $0.500 price point would be reinforced as a formidable support level.