Wall Street Memes (WSM) Market Recesses, Garnering Increases
Estimated Reading Time: 3 minutes
Don’t invest unless you’re prepared to lose all the money you invest. This is a high-risk investment and you are unlikely to be protected if something goes wrong. Take 2 minutes to learn more
Wall Street Memes Price Prediction – April 1
There has been consistency in the trade path that is affirming that buying activities are holding on a good promissory baseline against the presence of bears as regards the worth of Wall Street Memes coin versus the valuation of the US dollar, as the current financial outlook of the pairing reports that the market recesses in action, garnering increases at a lower trade zone.
Both buyers and sellers have been actively engaging in a price battle around the middle and lower Bollinger Bands, highlighting the $0.001 trade line as a crucial level for long-term market participants. This zone remains pivotal for sustaining momentum amid volatile price action, as the prolonged bullish outlook starts to materialize with increasing strength.
WSM/USD Market
Key Levels
Resistance levels: $0.002, $0.0025, $0.003
Support levels: $0.0008, $0.0006, $0.0004
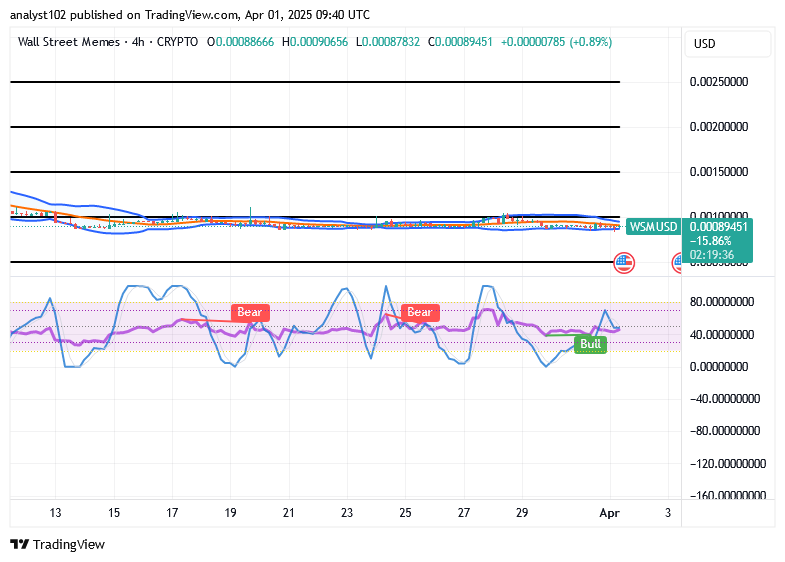
WSM/USD – 4-hour Chart
The WSM/USD medium-term chart reveals that the crypto-economic market currently recesses below $0.001, garnering increases in their inputs.
The WSM/USD market is once again displaying signs of bullish momentum, as the stochastic oscillators have registered a bullish signal after dipping into the oversold region. Meanwhile, the Bollinger Bands indicators continue to trend in a horizontal consolidation phase, forming a flat baseline pattern. This movement emphasizes the $0.001 level as a critical trading zone that market participants should closely monitor.
From a technical standpoint, does it remain viable to execute buy and sell positions around the middle and lower Bollinger Bands, considering the current consolidation phase in the WSM/USD market?
The kind of feeble reactions being exhibited in the WSM/USD market operations has led to seeing the trade being caged tightly between the middle and the lower Bollinger Bands, as the current situation now reports that the price currently recesses, garnering increases.
With the present portending signal output from the perspectives of the stochastic oscillators at the oversold axis, it indicates that long-term position traders, institutional investors, and swing traders are gradually establishing accumulation zones ahead of a potential prolonged bullish retracement, price reversal, and market correction in the crypto asset.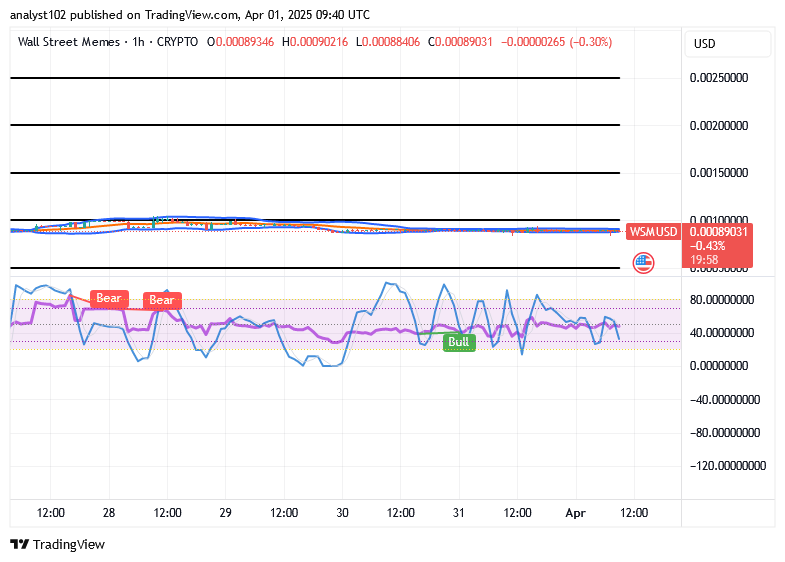
WSM/USD 1-hour chart
The WSM/USD 1-hour chart showcases that the short-term pricing arrangement of the crypto-economic trade recesses, garnering increases.
In the hourly timeframe, the Bollinger Bands’ trend lines are structured to encapsulate varying candlestick formations, reflecting market activity in a sideways direction. Meanwhile, the stochastic oscillators have exhibited a renewed bullish signal, oscillating through fluctuations to indicate potential upward momentum.
$WSM community, we noticed your Tweets!
$WSM community, we saw your Tweets! 👏$WSM / $USDT is now tradeable on #Bybit Perpetuals.
— Bybit (@Bybit_Official) October 13, 2023
Trade here: https://t.co/le4XyVyXaZ
Also want your project listed? Share your suggestions here:https://t.co/W7EWJVVNV5 https://t.co/XgXoL7g0rF