Jito (JTO/USD) Breaks Bearish Grip With Decisive Bounce
Estimated Reading Time: 3 minutes
Don’t invest unless you’re prepared to lose all the money you invest. This is a high-risk investment and you are unlikely to be protected if something goes wrong. Take 2 minutes to learn more
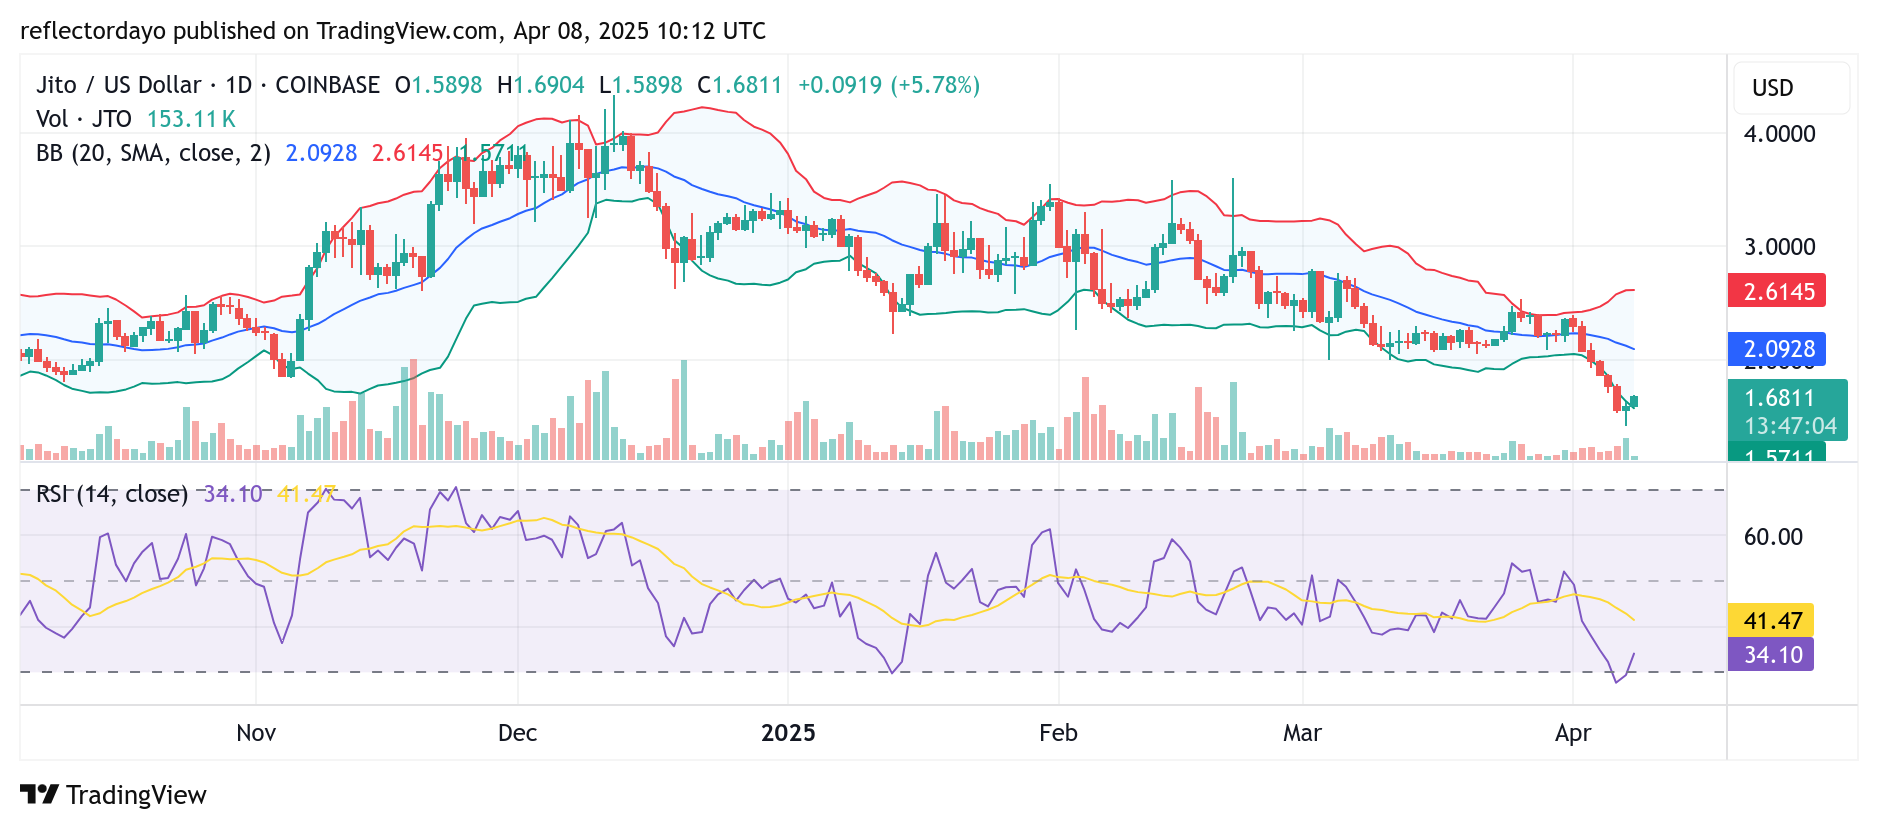
Aside from the recent sharp breakdown below the $2.00 level, the Jito (JTO/USD) market has been in a prolonged bearish trend. This downward trajectory began in December last year, following a significant decline from the $4.30 price zone.
Upon reaching the $2.00 level, there were initial signs of a potential bullish reversal, as buying interest began to surface and the market entered a phase of consolidation. However, this support eventually gave way, leading to an intensified bearish sentiment and a deeper decline in price.
Despite this crypto signal, the market managed to establish a pivotal support at the $1.40 level, where bullish activity resurfaced. This renewed momentum has since helped steer the market back in an upward direction, signaling a possible end to the recent downtrend.
Jito Market Data
- JTO/USD Price Now: $1.68
- JTO/USD Market Cap: $503 million
- JTO/USD Circulating Supply: 314 million JTO
- JTO/USD Total Supply: 1 billion JTO
- JTO/USD CoinMarketCap Ranking: #91
Key Levels
- Resistance: $40, $45, and $50
- Support: $35, $30, and $25
Jito Market Through the Lens of Indicators
Following the breakdown below the $2.00 level, the Jito traders adopted a more bearish outlook, which intensified the selling pressure and pushed the price even lower. However, the decline was halted at the $1.40 level, where the market appeared to find significant support.
At this point, the Relative Strength Index (RSI) indicated that the market had entered oversold territory, suggesting the potential for a corrective move. The RSI line has since signaled a rebound from that oversold zone, pointing to a possible shift in momentum.
While there has been noticeable buying activity since the bounce, the market may still be operating under the influence of broader bearish sentiment. For a sustainable bullish recovery to be confirmed, an increase in trading volume is essential. Currently, volume histogram bars remain relatively low, which may imply that the upward move lacks strong conviction. As a result, the market could either enter a consolidation phase or face renewed downward pressure.
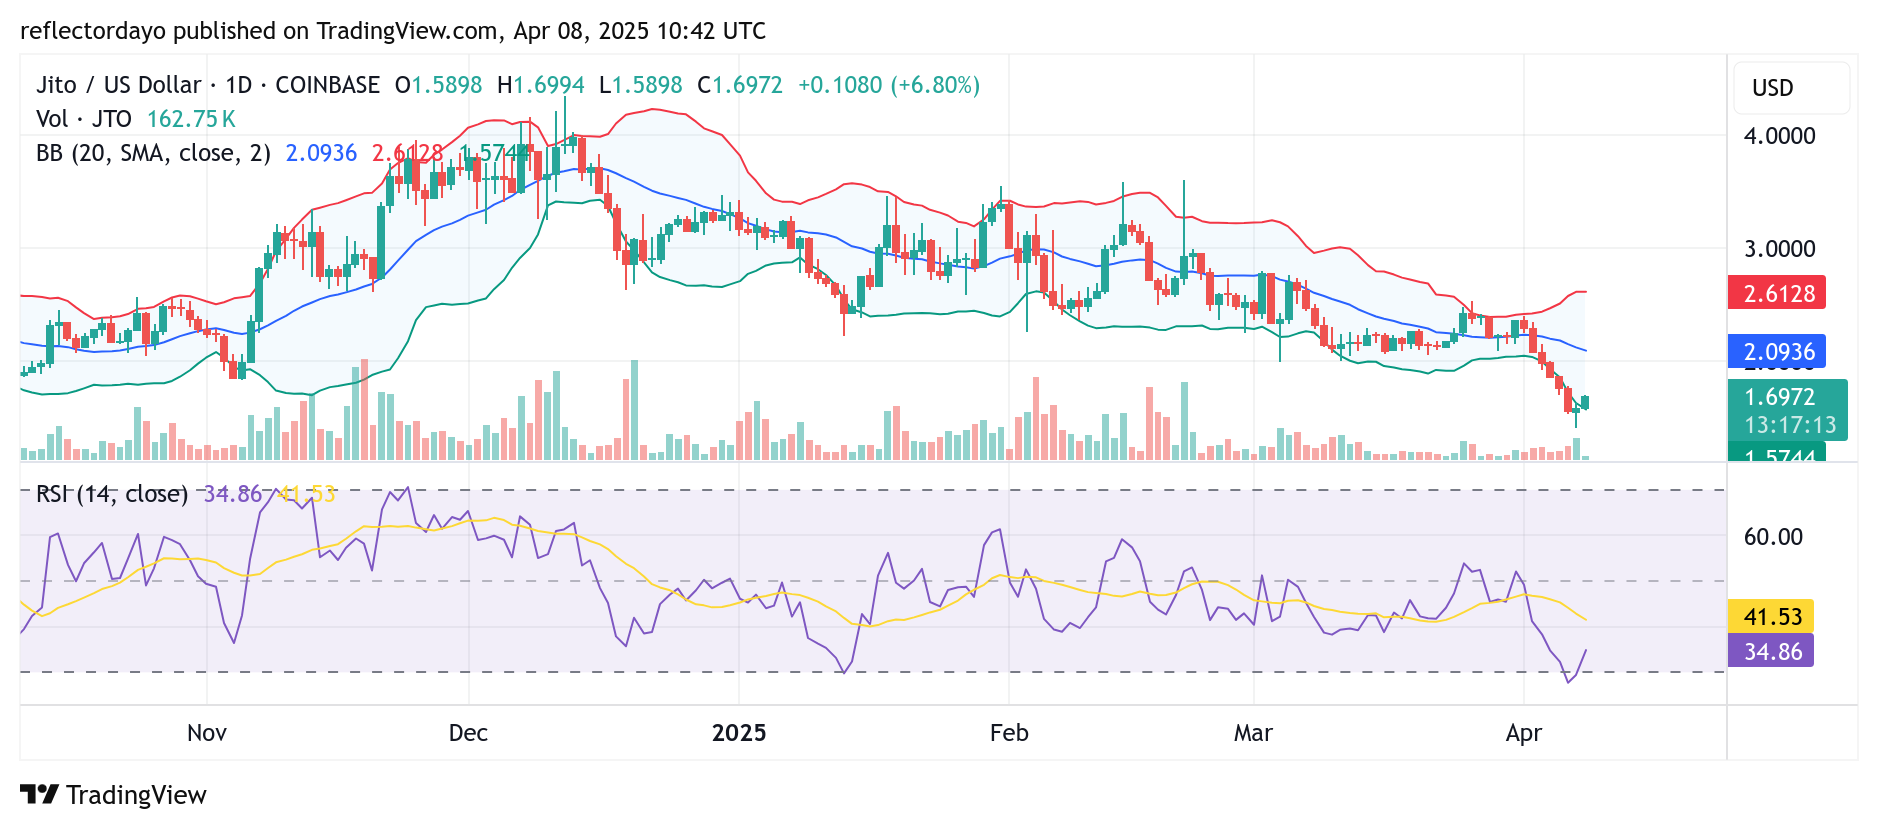
JTO/USD Price Outlook: Key Insights from the 4-Hour Chart
The 4-hour chart reinforces the sentiment observed on the daily chart, aligning with the broader market outlook. Bullish candlesticks appear to be losing momentum as the price approaches the $1.70 level.
The Relative Strength Index (RSI) suggests that this price point may act as a key equilibrium level, where buying and selling pressures could temporarily balance out, leading to a potential consolidation phase. As shown on the chart, the RSI line is trending upward toward the midpoint of the indicator — the 50 level — signaling a shift from oversold conditions toward a more neutral market stance.