Zcash (ZEC/USD) Bulls Hold the Line: $36 Emerges as Key Support
Estimated Reading Time: 3 minutes
Don’t invest unless you’re prepared to lose all the money you invest. This is a high-risk investment and you are unlikely to be protected if something goes wrong. Take 2 minutes to learn more
The Zcash market has recently showcased the strength of its ongoing bullish recovery, with price action remaining buoyant around the $36 mark—now serving as a higher support level. Despite periods of heightened downward volatility, bearish momentum proved unsustainable, as buyers firmly rejected lower prices during today’s trading session.
The market had previously been in a downtrend until it found critical support at the $28 level. This pivotal zone has since anchored the recovery, enabling bulls to regain control and sustain upward momentum.
Zcash Market Data
- ZEC/USD Price Now: $36.44
- ZEC/USD Market Cap: $545.6 million
- ZEC/USD Circulating Supply: 15.88 million ZEC
- ZEC/USD Total Supply: 15.9 million ZEC
- ZEC/USD CoinMarketCap Ranking: #89
Key Levels
- Resistance: $40, $45, and $50
- Support: $35, $30, and $25
Zcash Market Through the Lens of Indicators
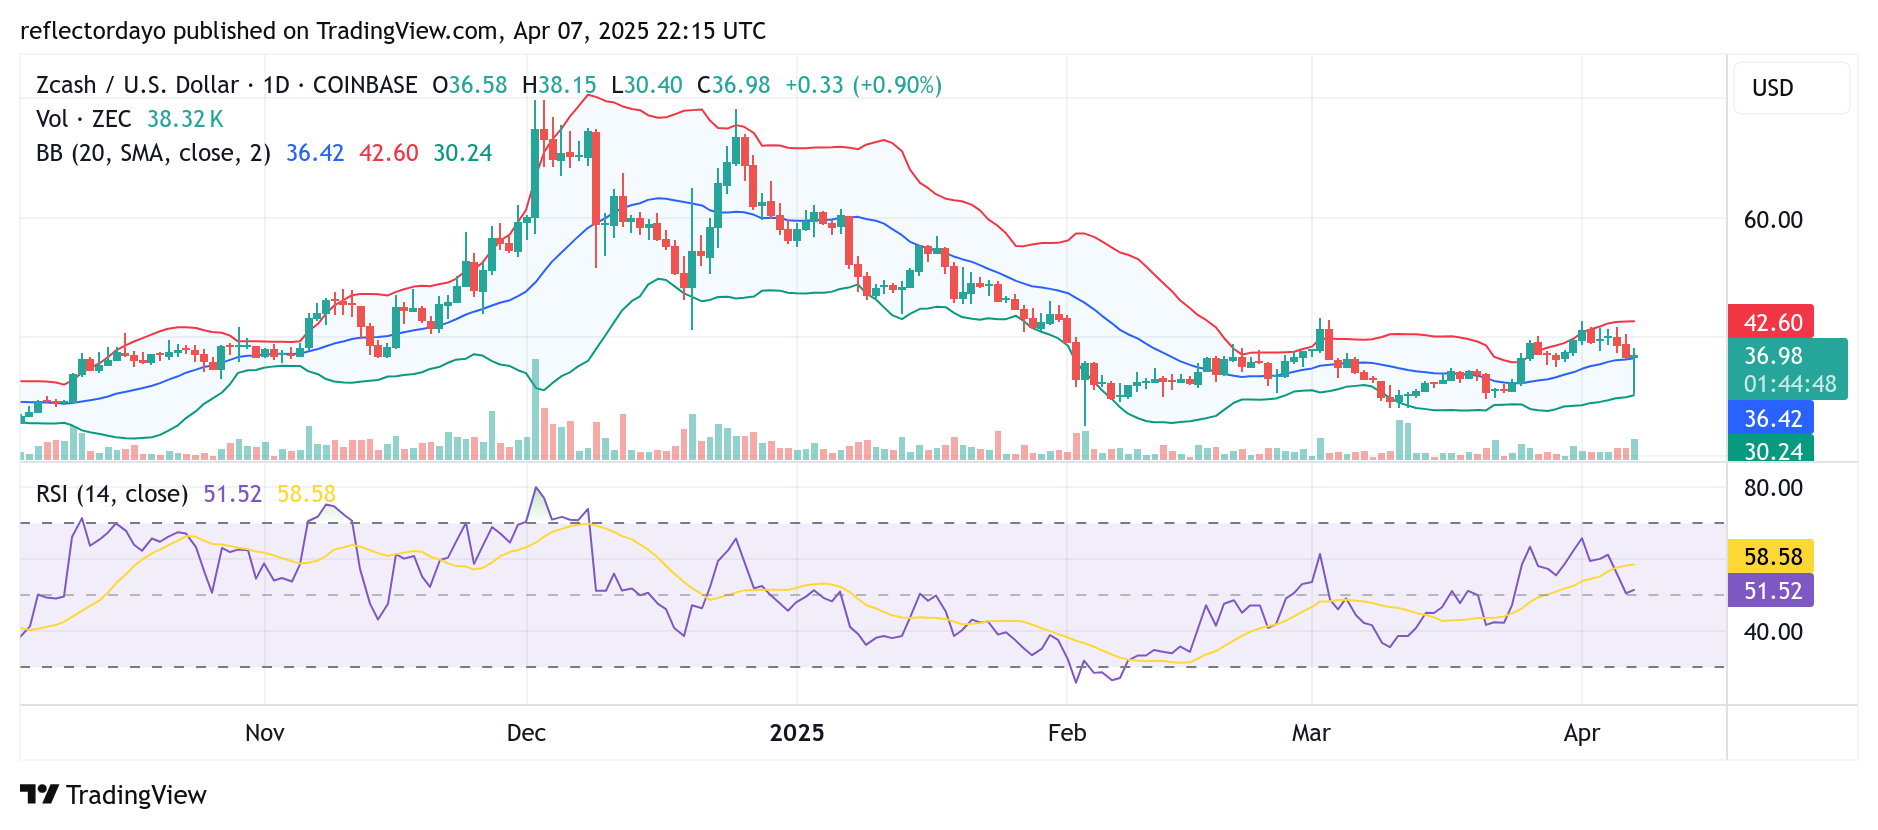
As the bullish recovery from the $28 support level continues, the Zcash market recently encountered resistance at the $40 mark. This resistance prompted a round of profit-taking, leading to a price correction. However, strong support at the $36 level has kept the market buoyant, effectively limiting bearish momentum.
During today’s session, a brief spike in downward volatility pushed prices to test the $30 level. Despite this dip in the crypto signal, bearish sentiment proved short-lived, with buyers stepping in to lift the price back to the $36 zone.
While the Bollinger Bands indicate elevated volatility, the current price hovering near the midpoint suggests a standoff between buyers and sellers. If this equilibrium persists, a consolidation phase may form around the $36 level, potentially setting the stage for the next decisive move.
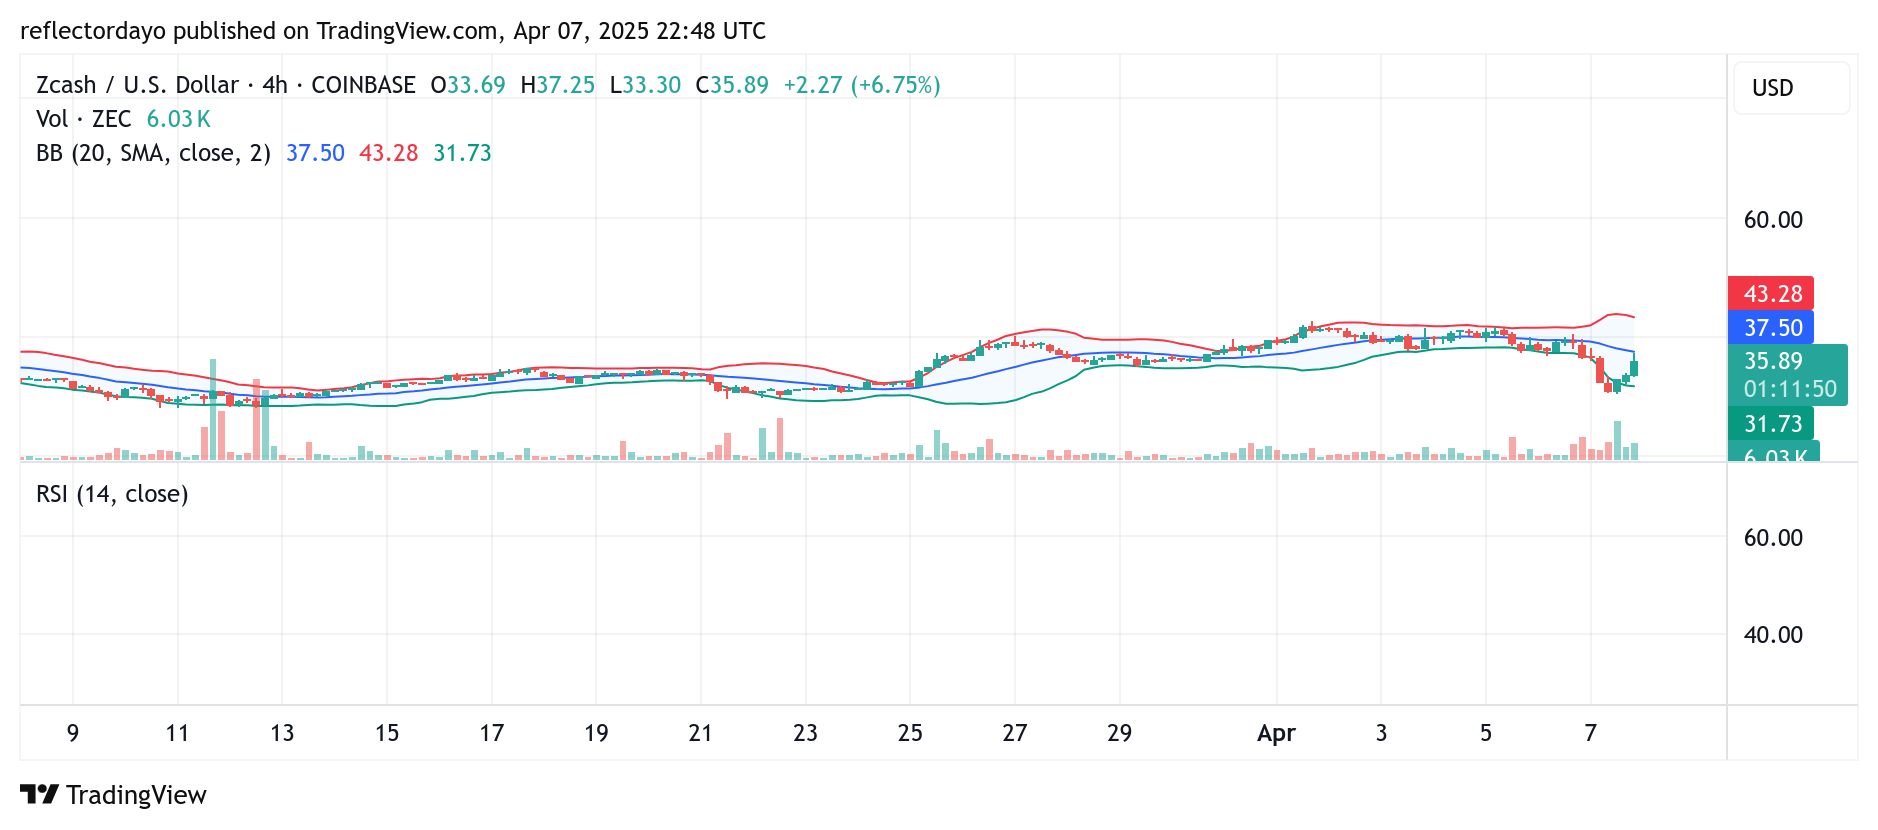
ZEC/USD Price Outlook: Key Insights from the 4-Hour Chart
Today’s market action reflects heightened volatility. The session opened with bearish momentum, but after finding strong support at the $30 threshold, bullish forces quickly regained control, sparking a notable price rally.
The sharp price fluctuations and the widened Bollinger Bands highlight increased market volatility, indicating the potential for significant price swings in the near term.
However, as observed on the daily chart, if the price can stabilize at the current level, it may pave the way for a sustained recovery. This could position the market for a potential breakout above the critical $40 resistance level.