Solana (SOL/USD) Price Is Tempting a Fall toward $10
Estimated Reading Time: 3 minutes
Don’t invest unless you’re prepared to lose all the money you invest. This is a high-risk investment and you are unlikely to be protected if something goes wrong. Take 2 minutes to learn more
Solana Price Prediction – December 24
Some left-over sell-off forces dominate the SOL/USD market operation as the price tempts a fall toward the $10 line. The market’s weight to the south side is at 3.99 negatively in percent, trading at the $11.32 value line.
SOL/USD Market
Key Levels:
Resistance levels: $20, $25, $30
Support levels: $10, $7.50, $5
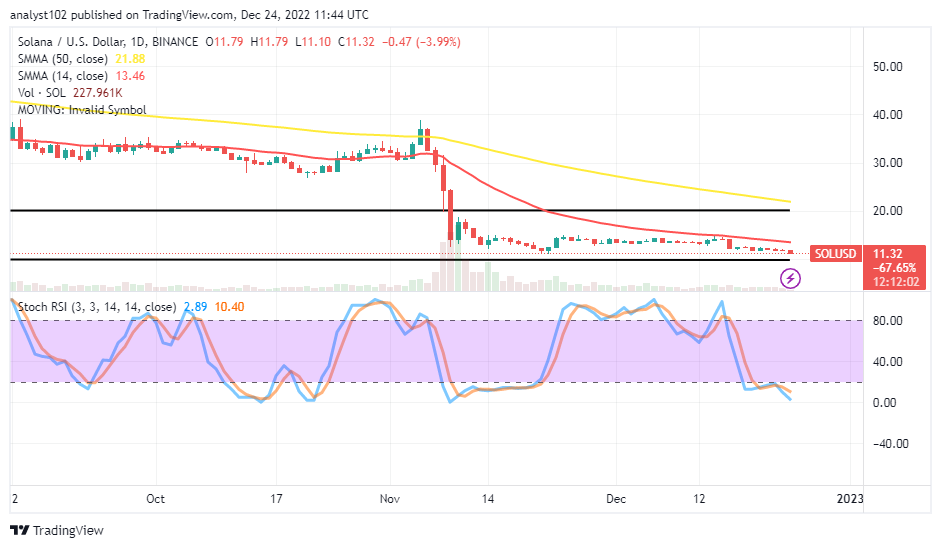
SOL/USD – Daily Chart
The SOL/USD daily chart reveals that the crypto’s price tempts a fall toward the $10 lower range line. The buying and selling operations have seen modest falls in the range-bound zones over the past few days. The 50-day SMA indicator is at a 21.88 value line below the $13.46 point of the 14-day SMA indicator. The stochastic Oscillators have traveled southward into the oversold region, trying to point southbound further at 10.40 and 2.89 levels to indicate that selling gravity is still relatively on course.
Is it technically inclined to follow the SOL/USD market declining further outside the range points at $20 and $10?
To some reasonable extent, it is psychologically unwise to act alongside the SOL/USD trade operation declining more beyond the range-bound spots at $20 and $10 points as the crypto’s price is tempting a fall toward the lower range line. As for the time being, a stage has reached to expect a rebound soon in no time. Before buyers start re-launching their positions, they need to let an occurrence of a bullish candlestick take a proper form.
On the downside of the technical analysis, the trading situation appears to be gradually fading off from the purview of the SOL/USD market bears near the $10 support. In the meantime, there may be a continuity of the market subjecting a depression around the 14-day SMA. Bears would have to make the resistance point around the 14-day SMA instrumental in deciding when to exert a shorting position.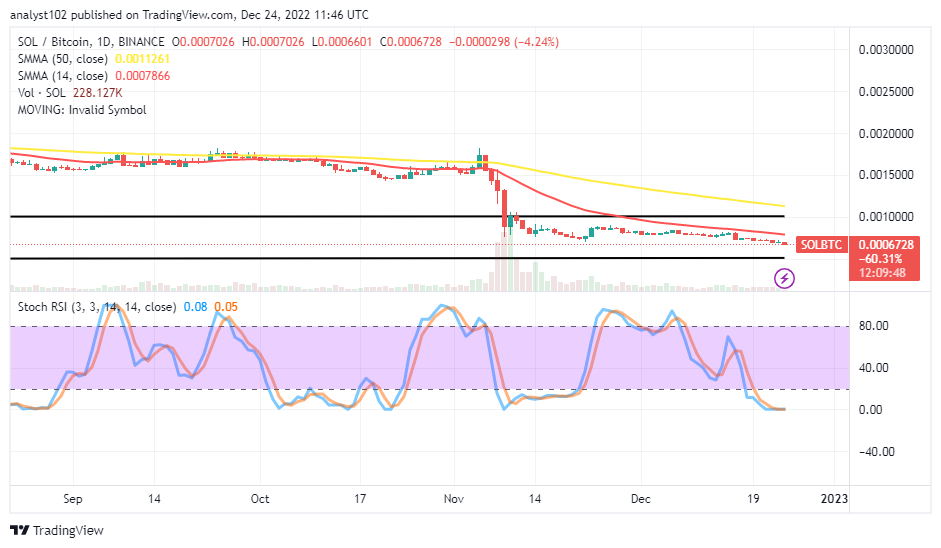
SOL/BTC Price Analysis
In comparison, Solana’s trending ability against Bitcoin’s pushing weight has continued to be in an outlook of succumbing to a depression caused by the latter trading instrument. The 14-day SMA indicator is underneath the 50-day SMA indicator. The Stochastic Oscillators have penetrated the oversold region maximally to 0.06 and 0.05 around the zero range. That implies the base trading crypto may soon free up from its debasement-moving style, pairing with its counter-trading crypto in no time.
Note: Cryptosignals.org is not a financial advisor. Do your research before investing your funds in any financial asset or presented product or event. We are not responsible for your investing results.
You can purchase Lucky Block here. Buy LBLOCK