Solana (SOL/USD) Market Remains Strong in the $20 and $10 Range
Estimated Reading Time: 3 minutes
Don’t invest unless you’re prepared to lose all the money you invest. This is a high-risk investment and you are unlikely to be protected if something goes wrong. Take 2 minutes to learn more
Solana Price Prediction – December 16
There has been a long prolongation of low-active motions between the two major trade movers in the SOL/USD operations as the crypto market remains strong in the $20 and $10 range. The transaction of the crypto economy is seen at $13.41 at an average negative percentage rate of 4.49.
SOL/USD Market
Key Levels:
Resistance levels: $20, $25, $30
Support levels: $10, $7.50, $5
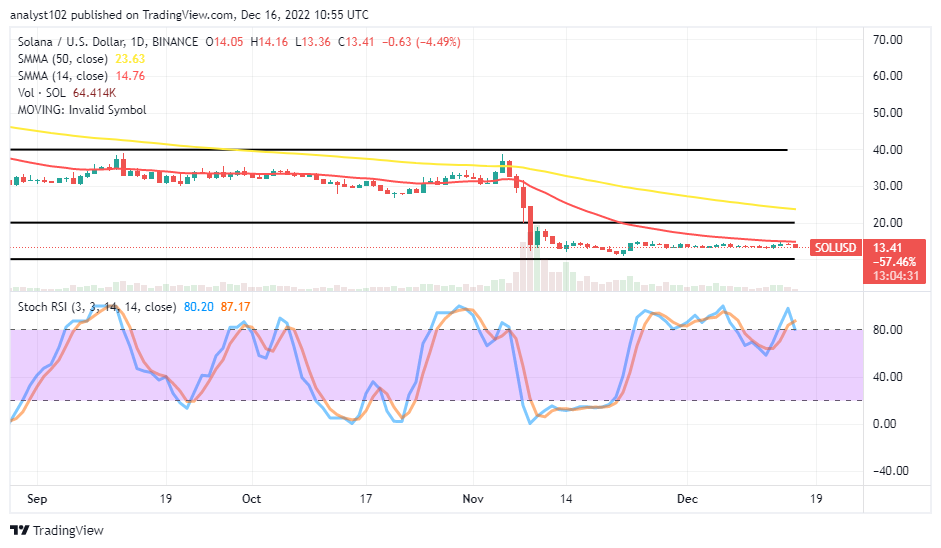
SOL/USD – Daily Chart
The SOL/USD daily chart showcases the crypto market remains strong in the #20 and $10 range. The horizontal lines are to mark those points for ascertaining. The 14-day SMA indicator has traveled southward into those range zones, keeping $14.76 below the $23.63 of the 50-day SMA indicator. The Stochastic Oscillators are around the overbought region, trying to cross their lines at 87.17 and 80.20 levels.
Will the SOL/USD market continue to feature in the $20 and $10 range for more days or weeks?
There will be a continuity of the SOL/USD trade operation to feature in the $20 and $10 range points as the crypto’s price remains strong in those values mentioned. Long-position placers have to take to the reading posture of the Stochastic Oscillators in the wake of determining the capacity range of the market at lower trading zones before considering an ideal buying order afterward. Price will likely lessen its pushing weight slowly to around the lower range value to build a baseline.
On the downside of the technical analysis, the SOL/USD market bears appear, attempting to push southward off to the downside of the 14-day SMA in the $20 and $10 range value lines. There is the possibility of prices falling in any manner in the subsequent trading sessions. However, a rebound motion against the value of the smaller SMA trading indicator will potentially nullify forces to the downward side.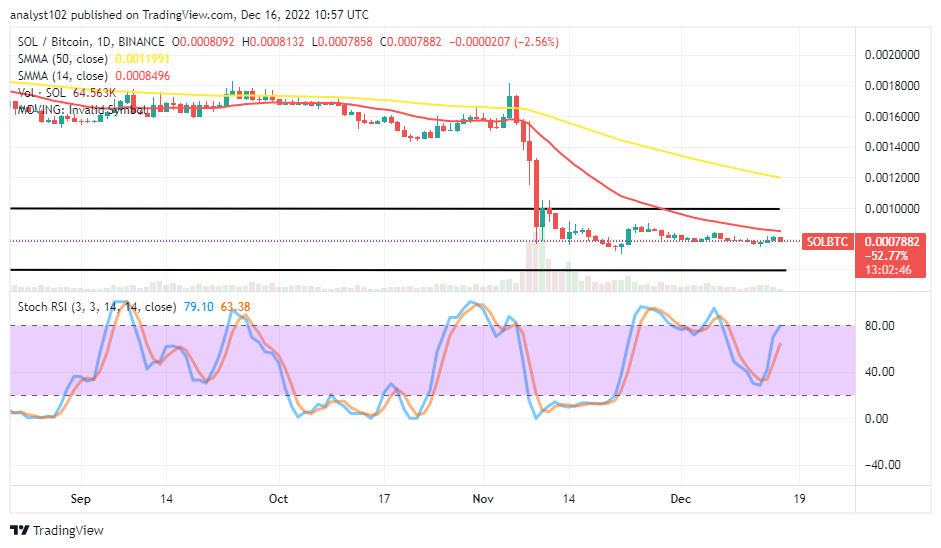
SOL/BTC Price Analysis
In comparison, Solana is currently trending under a depression of SMAs against the buying weight of Bitcoin. The cryptocurrency pair price remains strong as it features lower lows in well-defined range-bound zones. The Stochastic Oscillators have moved northbound to 63.38 and 79.10 levels. And they are in an outlook of trying to cross southward with a smaller candlestick in the making for affirmation. That connotes the base crypto may still be a falling course against its counter-trading crypto economy.
Note: Cryptosignals.org is not a financial advisor. Do your research before investing your funds in any financial asset or presented product or event. We are not responsible for your investing results.
You can purchase Lucky Block here. Buy LBLOCK