Ethereum (ETH/USD) Price Faces Resistance at $3,750
Estimated Reading Time: 3 minutes
Don’t invest unless you’re prepared to lose all the money you invest. This is a high-risk investment and you are unlikely to be protected if something goes wrong. Take 2 minutes to learn more
Ethereum Price Prediction – October 11
The ETH/USD price faces resistance around the level of $3,750 over a couple of trading days’ sessions. As of writing, the crypto economy outweighs the US Dollar at a percentage rate of about 5.63, trading around $3,609.
ETH/USD Market
Key Levels:
Resistance levels: $3,750, $4,000, $4,250
Support levels: $3,000, $2,750, $2,500
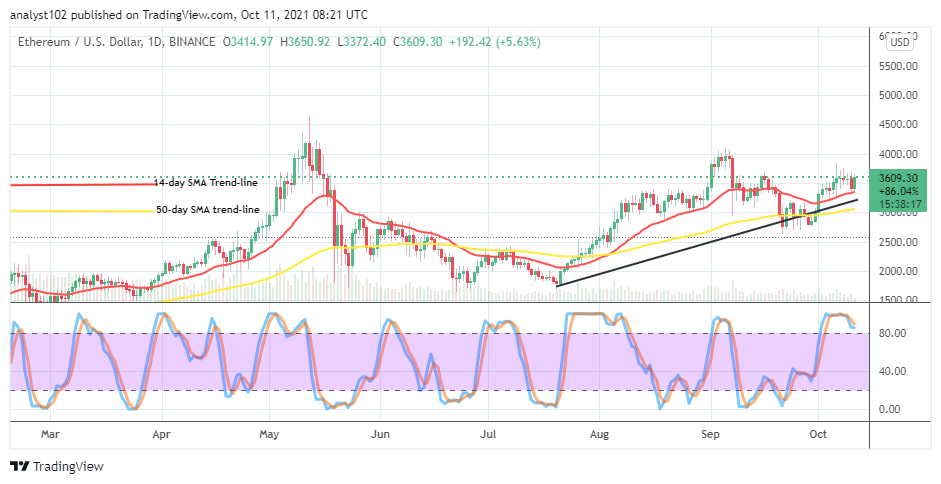
ETH/USD – Daily Chart
The ETH/USD daily chart showcases that the crypto market’s price faces resistance around the level of $3,750. The 14-day SMA trend line is above the 50-day SMA trend line as the bullish trend line drew to play a supportive role between them. The Stochastic Oscillators are seemingly attempting to cross the conjoined lines northbound. That could mean that the crypto market will witness more increases in valuation at the expense of the US Dollar’s weaknesses.
Could there still be more ups than downs as the ETH/USD price faces resistance around $3,750?
It is still clear that the ETH/USD market operations are in a bullish trend outlook to maintain a stance of seeing more ups than downs as price faces resistances around $3,750 level. There is a setup of candlesticks around the point characterized by top shadows, signaling a warning against the crypto’s worth pushing northward sustainably.
On the downside of technical analysis, it has distinctively established that major resistances are around $3,750. Therefore, decent shorting positions are to feature for some time. A violent pushes away northward from the value line devoid of retracement will put bears into a loss of momentum furthermore. Meanwhile, the higher resistance line at $4,000 will be the next target where selling positions may have to reposition while that assumption plays.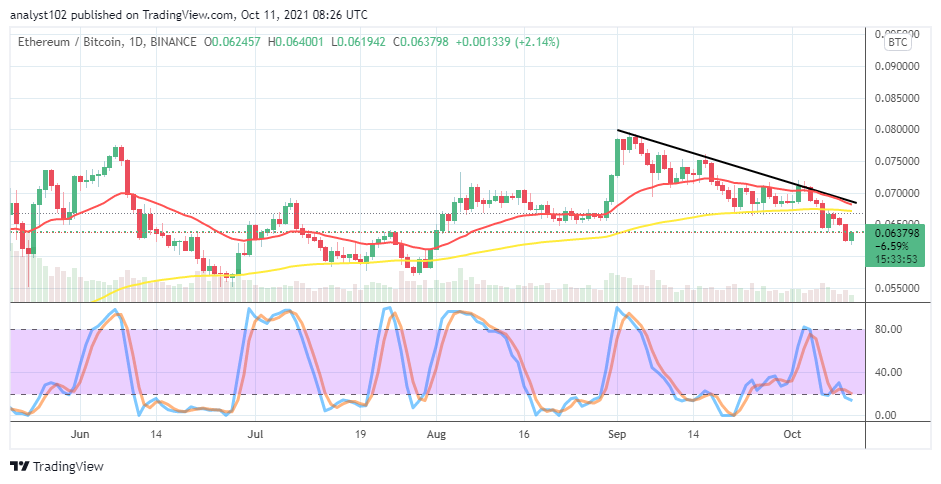
ETH/BTC Price Analysis
The market operation between Ethereum and Bitcoin on the price analysis chart shows that the cryptocurrency pair price dumps southward further beneath the indicators. That means the base crypto is overwhelmed to some extent by the counter crypto. The 14-day SMA indicator is above the 50-day SMA indicator, slightly bending southward. The Stochastic Oscillators are around the range of 20 with a shorter length of consolidation. That portends that the base crypto may for a while still find it hard to trend against the counter trading instrument.
Note: Cryptosignals.org is not a financial advisor. Do your research before investing your funds in any financial asset or presented product or event. We are not responsible for your investing results.
You can purchase crypto coins here. Buy Tokens