Bitcoin (BTC) Price Prediction: BTC/USDT Approaches the $70K Mark
Estimated Reading Time: 3 minutes
Don’t invest unless you’re prepared to lose all the money you invest. This is a high-risk investment and you are unlikely to be protected if something goes wrong. Take 2 minutes to learn more

Bitcoin (BTC) Price Prediction: October 16
The Bitcoin market has started retracing higher price levels, with the token gradually approaching the $70,000 resistance level. This price point was last reached approximately two months ago.
BTC/USDT Long-term Trend: Bullish (Daily Chart)
Key Price Levels:
Resistance: $68,000, $69,000, $70,000
Support: $66,000, $64,000, $62,000
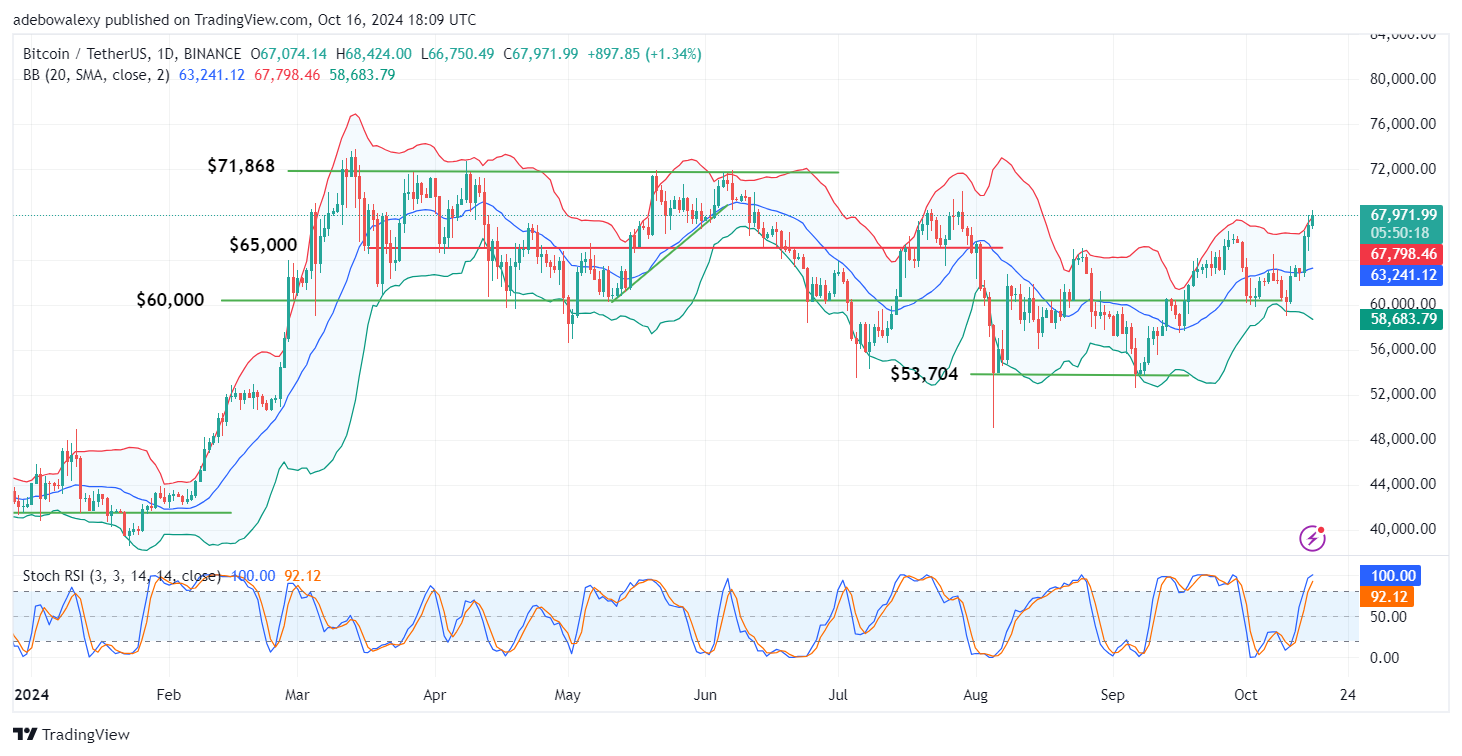
Price action gained strong momentum from the $60,000 support level. The market has sharply moved upward past the middle Bollinger Band since testing the $60,000 level as support. The current session continues to push the upper limit of the Bollinger Bands, appearing quite prominent. Similarly, the Stochastic Relative Strength Index (Stochastic RSI) is still rising into the overbought territory.
Bitcoin (BTC) Price Prediction: BTC/USDT Market Appears Strong Enough to Continue
The Bitcoin market has continued to display increasing bullish momentum. The most significant movement occurred over the past two sessions when the market bounced off support in the middle of the Bollinger Bands. Subsequent sessions have continued this trend, and the current session reflects this upward path.
The Stochastic RSI aligns with the prevailing trend, with both lines rising into the overbought region. The leading line has already reached the 100 mark, suggesting that upward price forces could continue to drive bullish corrections in the market.
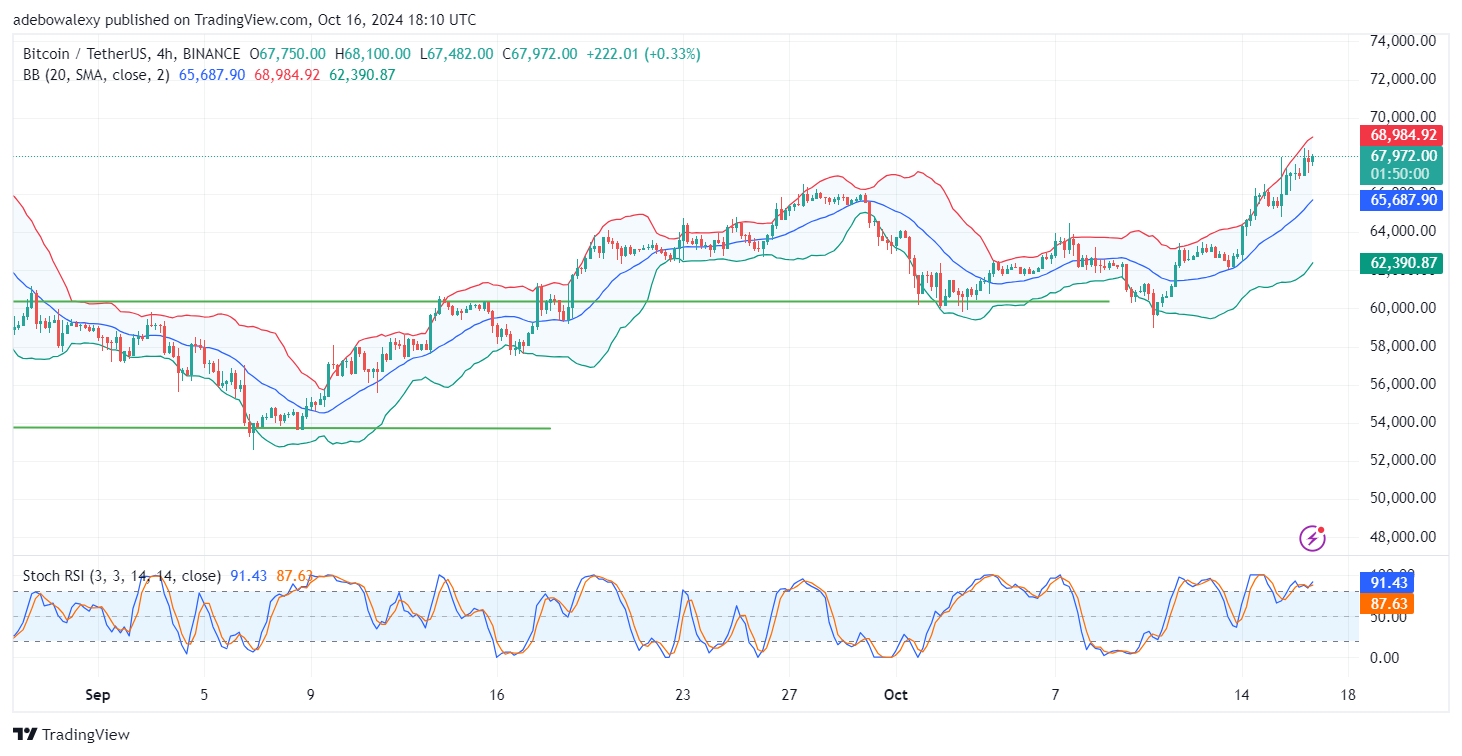
Bitcoin (BTC) Price Prediction: BTC/USDT Remains Bullish (4-Hour Chart)
The BTC/USDT 4-hour chart shows continued upward movement, consistently targeting higher price levels. Price action remains above the middle Bollinger Band and is approaching the upper limit of the indicator. The Bollinger Bands themselves are also trending upwards. Additionally, the Stochastic RSI has indicated a new bullish crossover above the 80 mark.
Summing up the technical indicators, price activity appears primed for further upward corrections. Notably, all indicators from the daily to the 4-hour chart suggest that buyers may continue to exhibit bullish behavior in the near term. Consequently, the $70,000 level may serve as a psychological target in this market.