Litecoin (LTC) Price Prediction: LTC/USDT Faces Strong Resistance Above the $66.50 Threshold
Estimated Reading Time: 3 minutes
Don’t invest unless you’re prepared to lose all the money you invest. This is a high-risk investment and you are unlikely to be protected if something goes wrong. Take 2 minutes to learn more

Litecoin (LTC) Price Prediction: October 15
The Litecoin market has been trending upward recently. However, since the previous session, price movement has been facing strong contractions, which have continued into the current session. This has significantly hampered the bullish progress of the coin.
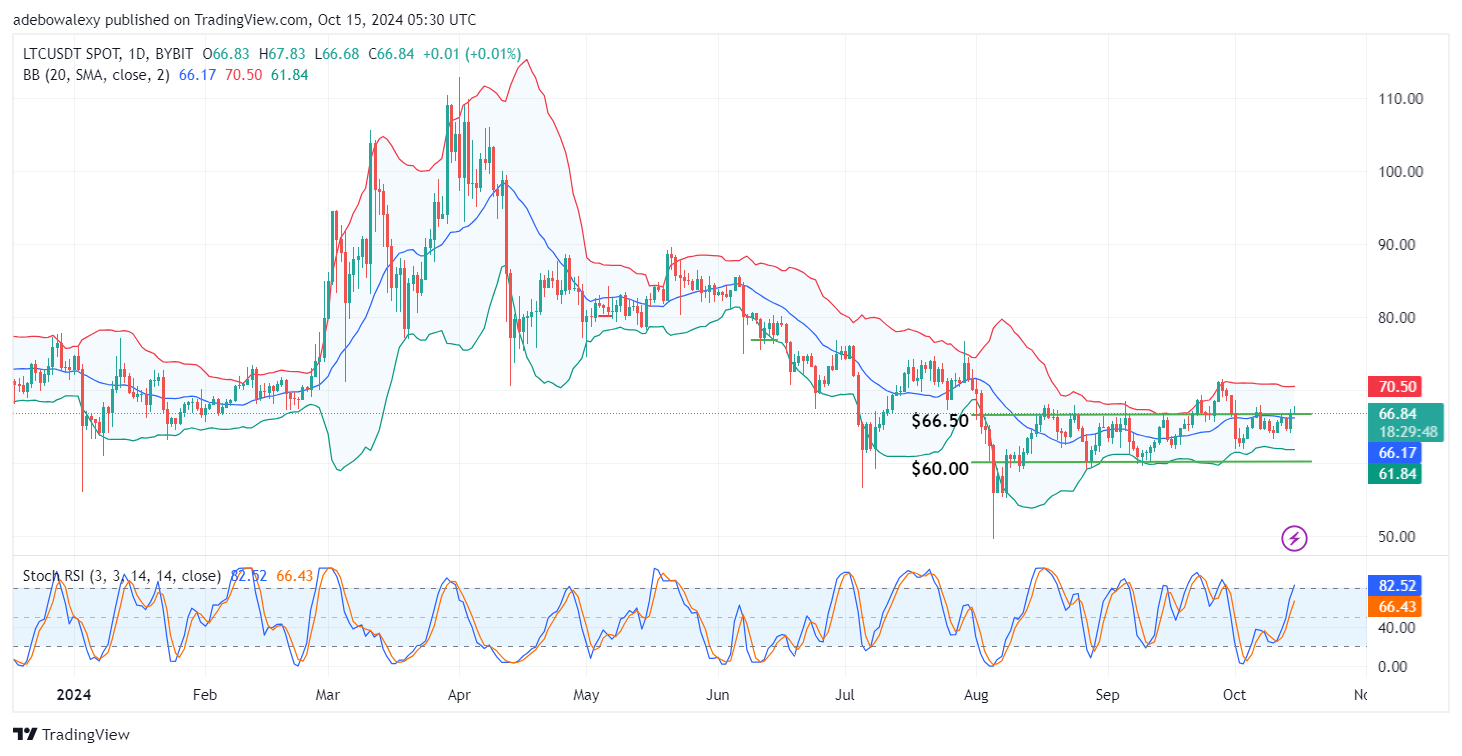
LTC/USDT Long-term Trend: Bullish (Daily Chart)
Key Price Levels:
Resistance: $67.00, $69.00, $71.00
Support: $65.00, $62.00, $60.00
Litecoin continues to trade above the 66.50 threshold, although by a very thin margin. The latest price candle on the chart has positioned the market above both the middle Bollinger Band and the $66.50 price level. Meanwhile, the Stochastic Relative Strength Index (Stochastic RSI) lines are rising into the overbought region in an exaggerated manner, considering the magnitude of the price movement.
Litecoin (LTC) Price Prediction: Upside Retracement Faces Strong Resistance in the LTC/USDT Market
It is evident from the daily Litecoin price chart that the market is struggling to rise toward higher price levels. Since the previous session, the market has seen considerable downward contractions. These have restricted upward price movement, leaving the corresponding price candles with conspicuous upper shadows.
Meanwhile, the Stochastic RSI lines are still rising into the overbought region. This is occurring at a time when market volatility is very thin, and the upside retracement is barely holding. Therefore, this technically suggests that the upside retracement may soon lose momentum.
Litecoin (LTC) Price Prediction: LTC/USDT Market Consolidates (4-Hour Chart)
Price activity in the 4-hour LTC/USDT market appears to be consolidating in a narrow range. Recent price candles are showing very small bodies with long upper shadows. Nevertheless, these candles continue to appear above the $66.50 threshold. Additionally, the Stochastic RSI lines remain in the overbought zone, indicating they may linger there for some time.
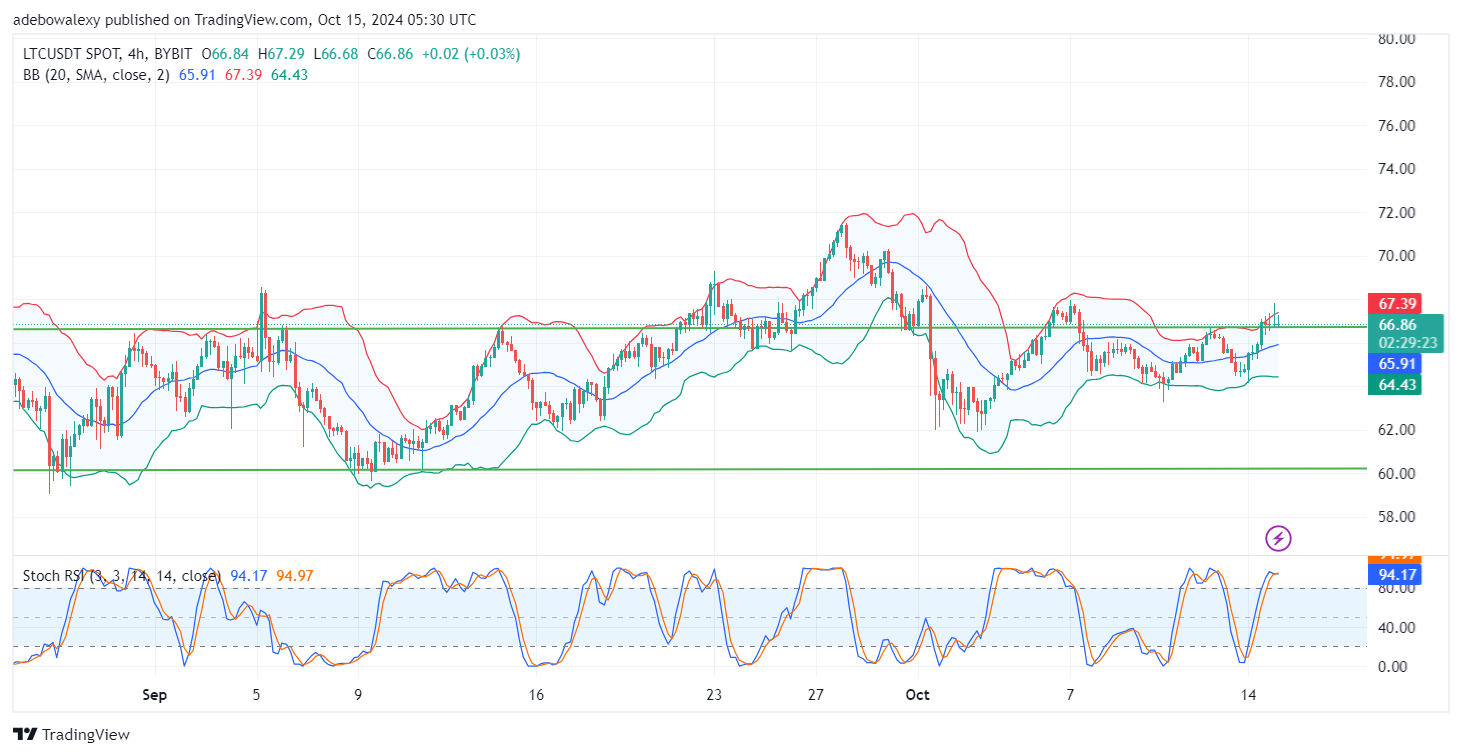
Consequently, price activity in this market suggests that bullish forces are trying to maintain support above the $66.50 threshold. As a result, the market may be poised to advance further toward the $70 mark, provided favorable fundamentals enter the market. Traders should keep this in mind while positioning a comfortable exit plan in case the market turns.