Dogecoin (DOGE/USD) Trade Confines Values Between $0.08 and $0.07
Don’t invest unless you’re prepared to lose all the money you invest. This is a high-risk investment and you are unlikely to be protected if something goes wrong. Take 2 minutes to learn more

Dogecoin Price Prediction – March 27
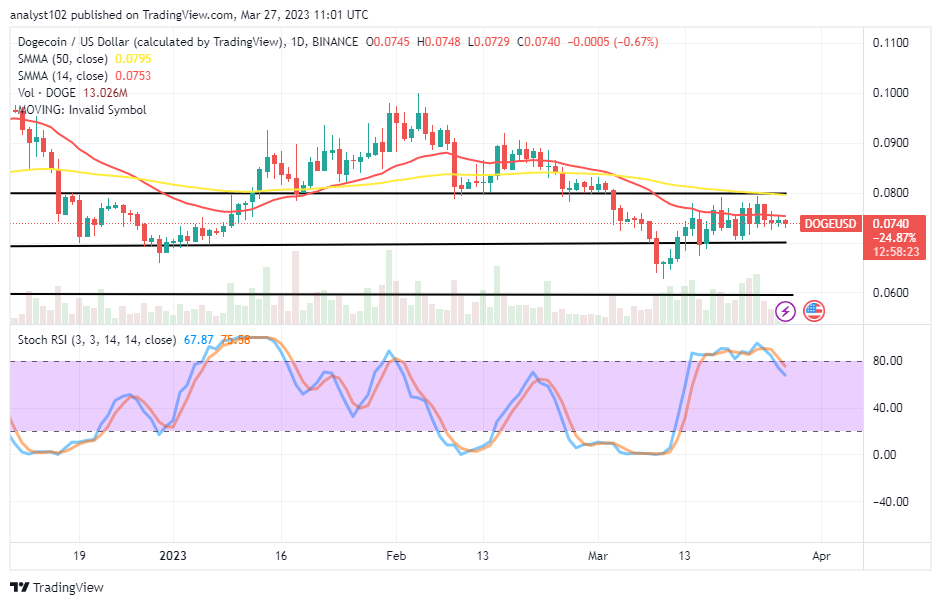
A line of low responsiveness has surfaced in the DOGE/USD market activities as the crypto-economic trade confines values between the $0.08 and $0.07 lines over a couple of sessions. At a minute negative percentage rate of 0.67, buyers’ and sellers’ capabilities are observed to be inside $0.0748 and $0.029, respectively. There are signs that some lows could yet form beneath the higher value line.
DOGE/USD Market
Key Levels:
Resistance levels: $0.080, $0.085, $0.090
Support levels: $0.065, $0.60, $0.55
DOGE/USD – Daily Chart
The DOGE/USD daily chart showcases the crypto-economic trade confines values between the $0.080 and $0.070 value lines. Variant trading candlesticks have emerged to demonstrate that a range trend has been on overtime around those points. The 14-day SMA indicator is at $0.0753, underneath the $0.0795 line of the 50-day SMA indicator. The Stochastic Oscillators have crossed briefly southward from the overbought region to maintain 75.58 and 67.87 levels.
What trading speed is the DOGE/USD market likely to maintain below the $0.080 resistance at the moment?
About the DOGE/USD market speed rate below the $0.80 resistance, the crypto-economic price will likely confine values between the value line and $0.070 for a while, mostly if the Stochastic Oscillators do not move to give a closure of an oversold condition.
While placing a trade at the current trading weight, bears should exercise caution around the $0.080 resistance line because it has been that this is a barrier trading point for the devaluation direction of the DOGE/USD technical analysis. The outlook suggests there are rooms for lows to push through maximally toward the lower range support at $0.060 in the long run. However, the Stochastic Oscillators’ placement in an oversold area and the subsequent appearance of a bullish trading candlestick may indicate that the base instrument is once again beginning to recover.
DOGE/BTC Price Analysis
In comparison, there is a sign that the Dogecocoin market may not spring up against the trading worth of Bitcoin firmly in the near time. Values are beneath the smaller SMA trend line by the crypto pairing trade. The 50-day SMA is higher than the 14-day SMA. The Stochastic Oscillators are in the overbought region, slightly crossed southbound at 90.35 and 85.14 levels. A string of smaller bearish candlesticks suggests that the base cryptocurrency will continue to decline when coupled with the counter cryptocurrency.
Note: Cryptosignals.org is not a financial advisor. Do your research before investing your funds in any financial asset or presented product or event. We are not responsible for your investing results.
You can purchase Lucky Block here. Buy LBLOCK


