Dogecoin (DOGE/USD) Market Switches to a Slow Force Below $0.08
Estimated Reading Time: 3 minutes
Don’t invest unless you’re prepared to lose all the money you invest. This is a high-risk investment and you are unlikely to be protected if something goes wrong. Take 2 minutes to learn more
Dogecoin Price Prediction – March 20
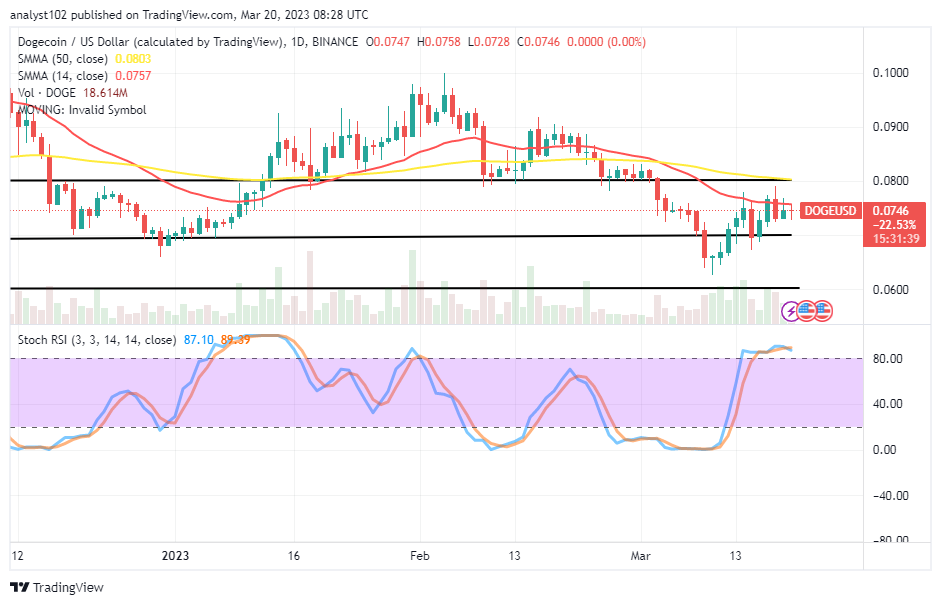
The DOGE/USD market has shifted from an upward movement throughout a session to a slow force below $0.08. Upward and downward trading motions have been somewhat stagnant between the $0.0758 and $0.0728 value lines at 0.00 percent, carrying a possible devaluation sign as of the time of this technical piece. That demonstrates that sellers are prepared to take back positions at any potential lack of bullish momentum at which a push to the upside beneath the resistance value mentioned earlier has almost worn out.
DOGE/USD Market
Key Levels:
Resistance levels: $0.080, $0.085, $0.090
Support levels: $0.065, $0.60, $0.55
DOGE/USD – Daily Chart
The DOGE/USD daily chart reveals the crypto-economic price switches to a slow force below $0.08, acting as the upper range. The upper range line drew around the point to ascertain the key barrier-trading line against the moves to the upside. The 50-day SMA trend line is at $0.0803 point, and the 14-day SMA trend line is at $0.0757. At 89.39 and 87.10 levels, the Stochastic Oscillators are in the overbought area.
Will the DOGE/USD swiftly shift valuation underneath the $0.080 resistance line in the subsequent operations?
A strong indication has had it at its optimum signal point that Dogecoin risks the stance of devaluing against the US Dollar swiftly beneath the $0.080 resistance line in the following days as it has observed that the crypto market has switched to a slow force below the value line. At this point, buyers need to exercise patience until a condition portends a lower-trading capacity or oversold condition from the reading of the Stochastic Oscillators.
On the southward motion of the DOGE/USD technical analysis, it has depicted that the US economy has been reshaping positions underneath the $0.080 resistance line in preparation style to drop. Sellers would now have to approach the market systemically by executing short orders in an instant or pending mode. A stop-loss order should be around a higher resistance line of the previously specified value.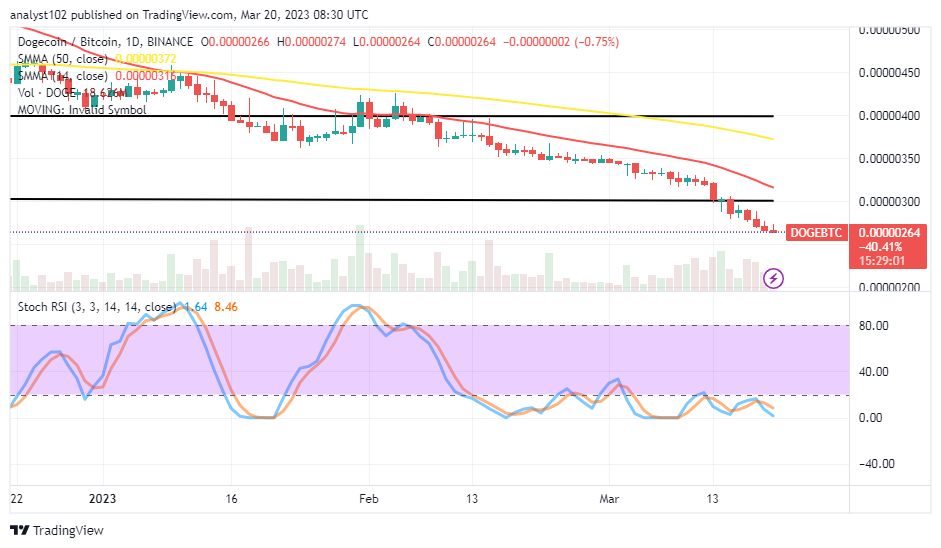
DOGE/BTC Price Analysis
In comparison, Dogecocoin has continued to decline in sequential mode, characterized by a range of little lows against the purchasing power of Bitcoin. The pairing crypto economy has maintained a slow force below the SMA trend lines. The 14-day SMA indicator is far underneath the 50-day SMA indicator, pointing to the south side. The Stochastic Oscillators are in the oversold region, maintaining a consolidation-moving outlook at 8.46 and 1.64 levels. It shows the selling pressures are still ongoing. A bullish trading candlestick has to form at a point to decimate the continuity of the current decline force at a particular point in time.
Note: Cryptosignals.org is not a financial advisor. Do your research before investing your funds in any financial asset or presented product or event. We are not responsible for your investing results.
You can purchase Lucky Block here. Buy LBLOCK