Dogecoin (DOGE/USD) Trade Finds Support Near $0.06
Estimated Reading Time: 3 minutes
Don’t invest unless you’re prepared to lose all the money you invest. This is a high-risk investment and you are unlikely to be protected if something goes wrong. Take 2 minutes to learn more
Dogecoin Price Prediction – March 13
Following a significant drop in the DOGE/USD market activities in the recent sessions, the crypto-economic trade finds a support spot to build upon near the $0.06 line. As of this technical piece time, price maintains trading zones between $0.0724 and $0.0686 value lines at an average negative percentage rate of 2.53. There has been a declining warning signal against getting smooth uprisings around the $0.070 zone.
DOGE/USD Market
Key Levels:
Resistance levels: $0.080$0.085, $0.090
Support levels: $0.065, $0.60, $0.55
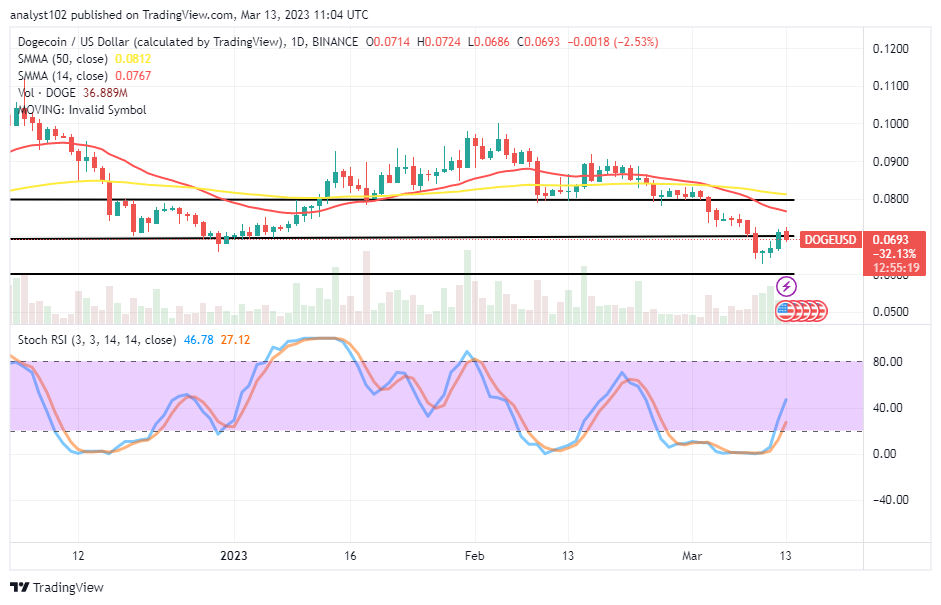
DOGE/USD – Daily Chart
The DOGE/USD daily chart showcases the crypto-economic trade finds support near the $0.06 range-bound zones. The value point is the lowest range axis of $0.70 and $0.080. The 14-day SMA trend line is at $0.0767, underneath the $0.0812 value line of the 50-day SMA trend line. The Stochastic Oscillators have crossed northbound from the oversold region to 27.12 and 46.78 points. In the meantime, a bearish candlestick has formed to oppose the possibility of witnessing more easy up-running.
What level of resistance does the DOGE/USD market need to breach before losing positions to the downside?
There have been pressures supporting moves to the upside, emanating in the DOGE/USD market as the crypto-economic trade finds support near the $0.060 level. Buyers must use caution while placing new longing orders, though, at the midpoint of the value line at $0.07, which it represents. And the maximal critical resistance trading line is pegged at $0.0767 against further volatile upsurges afterward.
On the downward movement of the DOGE/USD technical analysis, sellers may have to spend their positions around the value of the 14-day SMA and the value point of the 50-day SMA in extension. An aggressive breakout around those values may not see the light of day for long. Surfacing of rejections alongside the emergence of the current bearish candlestick will pave the way for featuring of lows around the $0.070 point.
DOGE/BTC Price Analysis
In comparison, Dogecocoin’s trending force yet features in falling mode, pairing with Bitcoin. The cryptocurrency pair market has not found support near the lower range line. The 14-day SMA indicator is underneath the 50-day SMA indicator. The Stochastic Oscillators have been moving in a consolidation manner, keeping 16.63 and 9.63 levels. The trending outlook still maintains a bearish trend. The trend may continue until a bullish candlestick forms in an attempt to breach the smaller SMA trend line.
Note: Cryptosignals.org is not a financial advisor. Do your research before investing your funds in any financial asset or presented product or event. We are not responsible for your investing results.
You can purchase Lucky Block here. Buy LBLOCK