$SPONGE (SPONGE/USD): Demonstrating Resilience in a Volatile Market
Estimated Reading Time: 3 minutes
Don’t invest unless you’re prepared to lose all the money you invest. This is a high-risk investment and you are unlikely to be protected if something goes wrong. Take 2 minutes to learn more

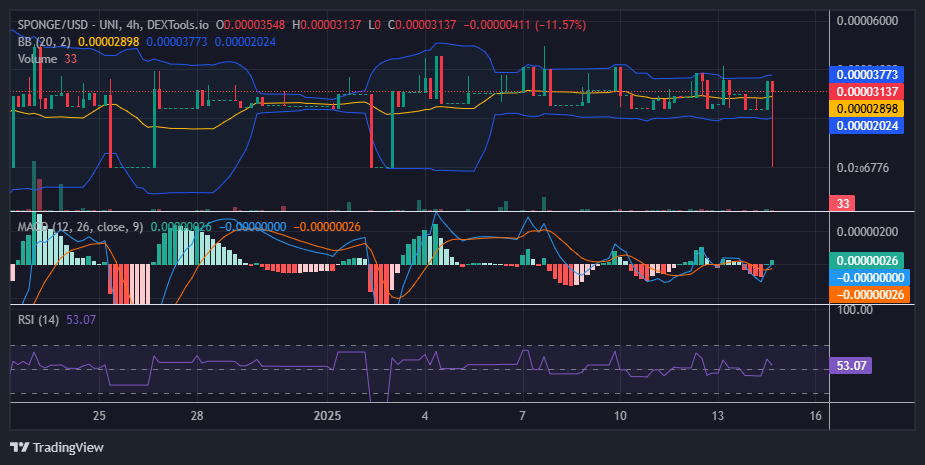
The $SPONGE market remains in a consolidation channel, with bulls holding firm around the $0.00003 level to prevent a downward drift. In the current trading session, the price is testing the critical $0.0000006 level but has encountered a swift and sharp bullish response at this point. This price action highlights the strength of the bulls in maintaining market stability.
The market continues to uphold its marginally ascending support level. Yesterday, we observed an upward shift in the market low from $0.000023 to $0.000025. In today’s session, there is a possibility that the $0.00003 level could be reclaimed as a new bullish support, signaling continued strength in the crypto market.
Key Market Dynamics:
- Resistance Levels: $0.00005, $0.000055, $0.000060
- Support Levels: $0.000020, $0.0000195, $0.000019
$SPONGE (SPONGE/USD) Technical Analysis
As the broader crypto market recovers from its recent downturn, the $SPONGE market has demonstrated resilience, successfully avoiding a drop to the critical support level at $0.0000006. Although the price briefly fell sharply to this level in the current trading session, the bulls quickly regained control, driving the price back above the $0.00003 mark.
The market’s recovery above this level, coupled with a break above the 20-day moving average, is a positive indicator. Holding above the 20-day moving average signals bullish dominance and suggests the potential for continued upward momentum.
$SPONGE (SPONGE/USD) 1-Hour Chart Observations
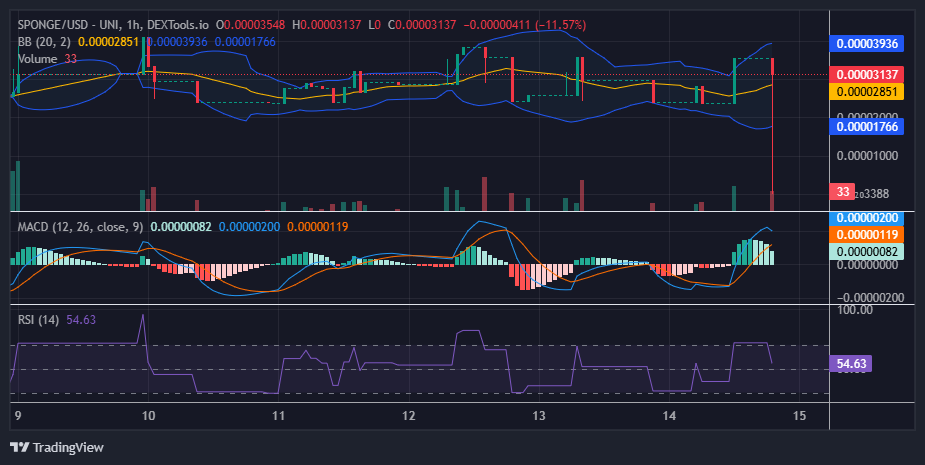
Zooming into the 1-hour timeframe, the Bollinger Bands reveal heightened market activity and increased volatility. The wide bands on this shorter timeframe indicate significant price fluctuations, reflecting the market’s dynamic nature.
A standout feature during this period, particularly in the ongoing 1-hour trading session, is a sharp price surge from $0.0000006 to above $0.000030—a clear demonstration of bullish momentum. This rapid ascent underscores the strength of the bulls and their ability to push prices higher.
With the 20-day moving average currently positioned near the $0.000030 level, this price point is likely to serve as a strong support for the market’s upward trajectory. The confluence of price action around the moving average suggests the potential for consolidation and heightened buying interest at this level.
Buy SPONGE/USD!
You smell dat DAMP? 💦 pic.twitter.com/tbyS93OvuK
— $SPONGE (@spongeoneth) January 12, 2025
Join the SPONGE community and be part of the next big crypto sensation! Buy Sponge ($SPONGE) today!