Dogecoin (DOGE) Price Prediction: DOGE/USDT Sees Strong Contention Below the $0.1119 Threshold
Estimated Reading Time: 3 minutes
Don’t invest unless you’re prepared to lose all the money you invest. This is a high-risk investment and you are unlikely to be protected if something goes wrong. Take 2 minutes to learn more

Dogecoin (DOGE) Price Prediction: October 14
The Dogecoin market resurfaced above the $0.1000 threshold about three sessions ago. However, the market hasn’t made much bullish progress since then. This suggests that price movement is facing a limiting force that may require significant momentum to overcome.
DOGE/USDT Long-term Trend: Bullish (Daily Chart)
Key Price Levels:
Resistance: $0.1150, $0.1200, $0.1300
Support: $0.1100, $0.1000, $0.0900
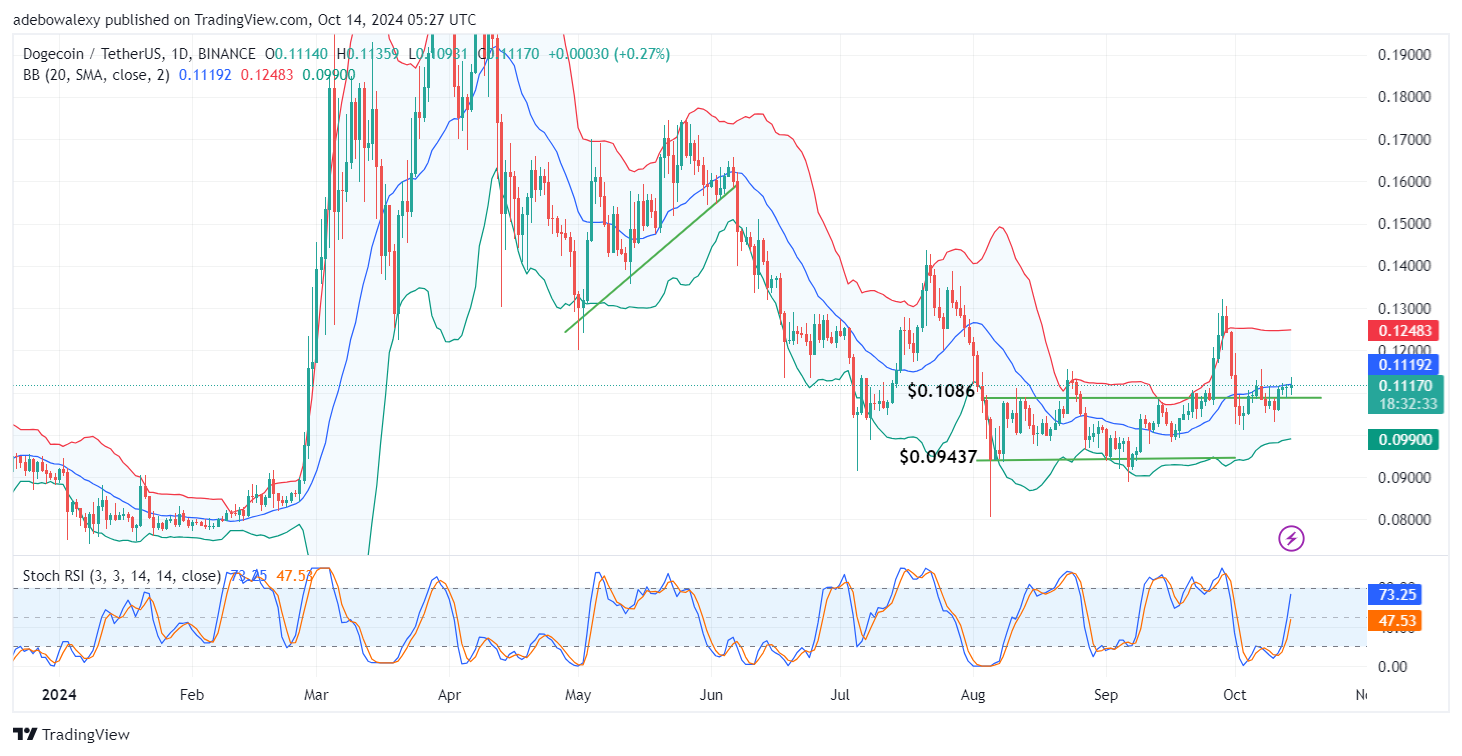
The past two sessions have shown minimal progress while remaining below the middle limit of the Bollinger Bands. Earlier in the ongoing session, the market briefly pushed through this resistance set by the middle limit of the Bollinger Bands but then retracted below it. This left the corresponding price candle with noticeable upper and lower shadows. Meanwhile, the Stochastic Relative Strength Index (Stochastic RSI) lines are still rising towards the overbought region.
Dogecoin (DOGE) Price Prediction: DOGE/USDT Bulls May Weaken
Looking at Dogecoin’s daily market activity, it’s evident that price action is facing significant resistance, which requires stronger bullish momentum to break. The price candle above the $0.1000 level shows that the market is struggling to make upward progress.
However, the Stochastic RSI lines continue rising, indicating that upside forces are still in play. The indicator’s movement seems somewhat exaggerated, considering the modest price increases observed. This suggests that if buyers fail to break the resistance at the middle limit of the Bollinger Bands, the bullish forces may weaken.
Dogecoin (DOGE) Price Prediction: DOGE/USDT Buyers Still Have Some Support (4-Hour Chart)
On the 4-hour Dogecoin chart, upside forces appear to have some support. Although the latest price candle is red, it hasn’t erased the gains from the previous session.
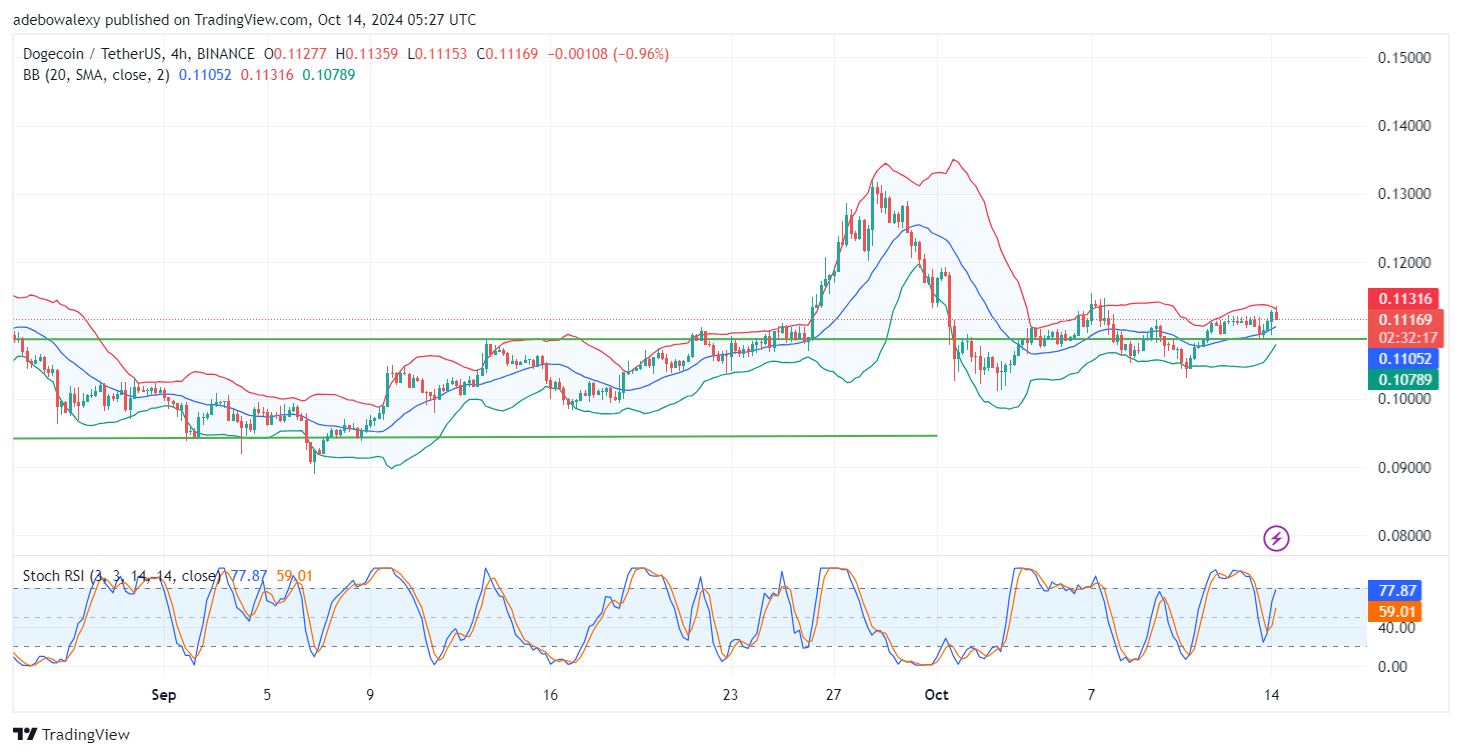
Moreover, trading activity remains above the middle Bollinger Band. A closer look at the Bollinger Bands reveals that the upper and lower bands are contracting, while the Stochastic RSI lines maintain a general upward trajectory. Therefore, it seems possible that the upward retracement may resume, potentially driving price action past the $0.1200 threshold.