$SPONGE (SPONGE/USD): Squeeze Play? Bollinger Bands Tighten After Support Test
Estimated Reading Time: 3 minutes
Don’t invest unless you’re prepared to lose all the money you invest. This is a high-risk investment and you are unlikely to be protected if something goes wrong. Take 2 minutes to learn more

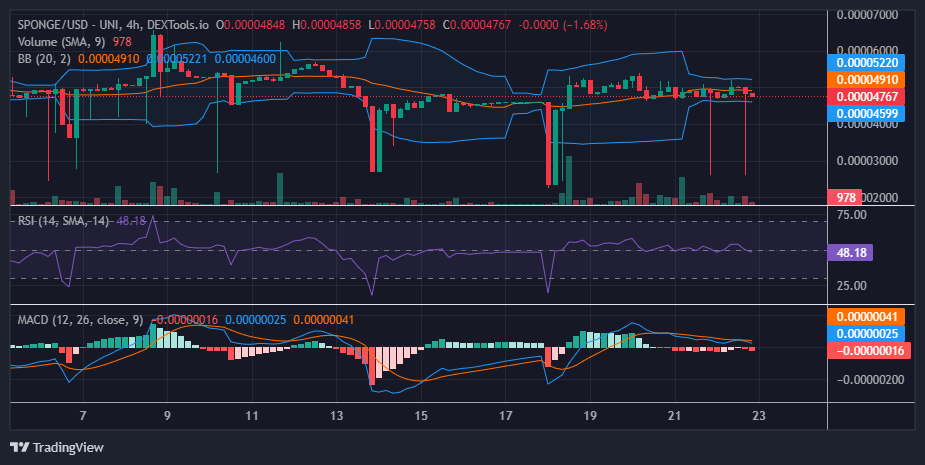
In our previous analysis of SPONGE/USD, we observed the market consolidating sideways near the $0.00005 price level. This level appears to be a temporary equilibrium point, with bulls and bears finding temporary parity. Swing highs and lows have been concentrated around this price. However, it’s noteworthy that bearish pressure tested lower levels in both the previous and current sessions. While this could suggest increasing bearish momentum, it also highlights the bulls’ continued defense around the $0.00005 support level.
Key Market Dynamics:
- Resistance Levels: $0.0010, $0.0011, and $0.0012.
- Support Levels: $0.000035, $0.000030, and $0.000025.
Delving into Technical Analysis for $SPONGE (SPONGE/USD):
The recent sharp contraction of the Bollinger Bands indicates a decline in volatility. Initially, both buyers and sellers failed to capitalize on the higher volatility, resulting in the sideways price action. This standoff likely contributed to the volatility decrease.
This kind of crypto signal, that is,this contraction, often precedes a breakout (price moves decisively above the upper band) or breakdown (price moves decisively below the lower band) from the recent trading range. Current technical indicators signal market indecision and consolidation.
The Relative Strength Index (RSI) sits near the midpoint, and the Moving Average Convergence Divergence (MACD) lines trade sideways above zero, suggesting neutrality. While the price currently resides slightly below the 20-day moving average, potentially hinting at a breakdown, the two recent price rejections on the downside suggest continued bullish strength around this price zone.
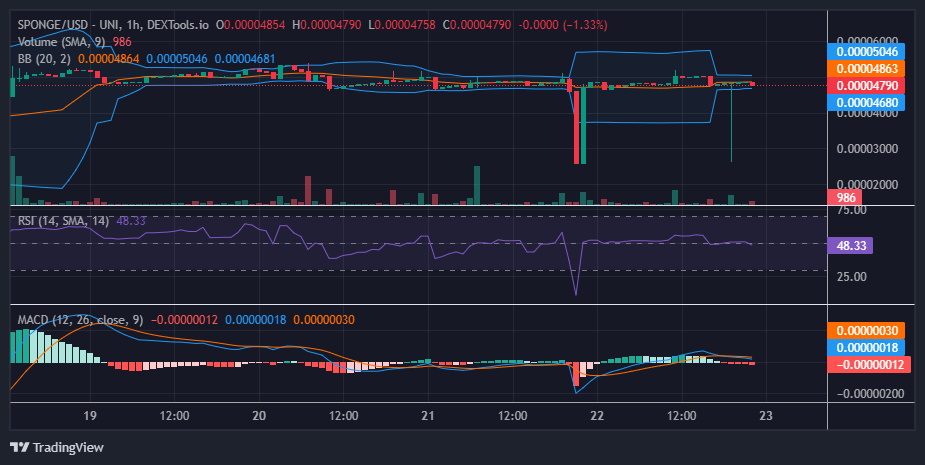
Insights from the 1-Hour Perspective:
Yesterday’s bearish move in SPONGE/USD unfolded over two one-hour sessions. Today, however, the bears’ attempt to push lower was contained within a single one-hour session. This potentially indicates a quicker rejection by the bulls compared to yesterday, suggesting a possible increase in bullish momentum. While this is a positive sign for the bulls, it’s not necessarily a confirmation of an imminent price breakout. Further observation and confirmation from other technical indicators are needed.
Buy SPONGE/USD!
Buy $SPONGE now, or FOMO in later; the choice is yours! 🧽💦#SpongeV2 #MemeCoin #Binance pic.twitter.com/qbKjvo6VwH
— $SPONGE (@spongeoneth) April 20, 2024
Invest in the hottest and best meme coin. Buy Sponge ($SPONGE) today!