Lucky Block (LBLOCK/USD) Market Indicators Signal Strong Bullish Reversal
Estimated Reading Time: 2 minutes
Don’t invest unless you’re prepared to lose all the money you invest. This is a high-risk investment and you are unlikely to be protected if something goes wrong. Take 2 minutes to learn more

Lucky Block Price Forecast – December 3
The LBLOCK/USD market indicators signal a strong bullish reversal. Following the short-side liquidity grab, a massive rally into the upside is now highly probable. The impending rally might continue into the $0.00002990 supply zone.
The 9-day Simple Moving Average (SMA) at $0.00001650 aligns closely with the current price of $0.00001650, suggesting potential bullish momentum. The Relative Strength Index (RSI) shows a value of 42.25, indicating the market is gradually recovering from oversold conditions. These indicators collectively point toward a strengthening bullish bias in the short term.
LBLOCK/USD Market Key Levels:
Resistance levels: $0.00002490, $0.00002990, $0.00003500
Support levels: $0.00001880, $0.00001600, $0.00001000
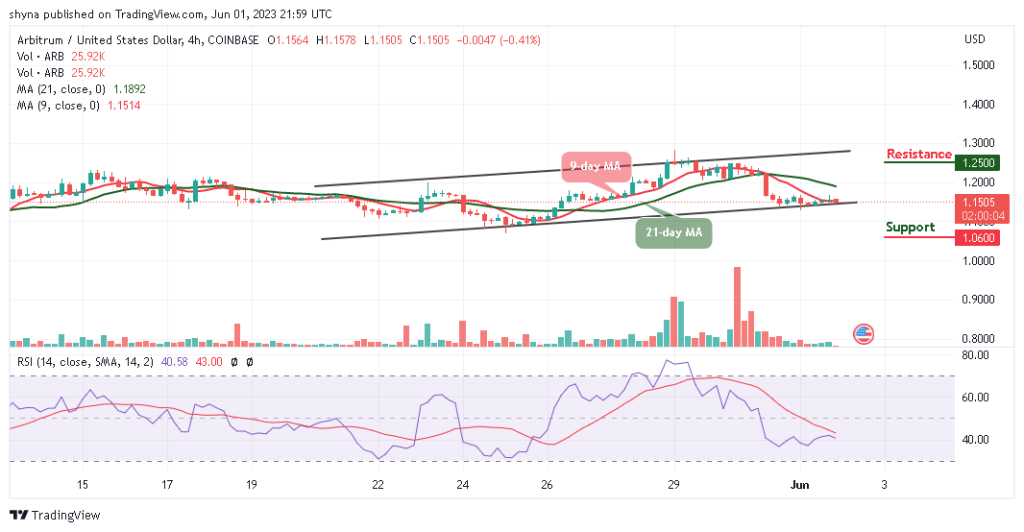
LBLOCK/USD – Daily Chart
The daily chart for LBLOCK/USD shows that the market is ready for a massive surge to the upside.
Price action highlights significant support at $0.000015340, from which a bounce has recently occurred. A descending trendline has been broken, reinforcing the likelihood of an upward move. The immediate resistance levels are at $0.00002990 and $0.00002490, with a clear rejection of lower prices below $0.00001540 emphasizing bullish strength.

What is expected of LBLOCK/USD in the coming days?
The projection sees LBLOCKUSD targeting $0.00002490 in the near term, with potential further rallies toward $0.00002990 and $0.00003500 if bullish momentum persists. The market is poised to maintain upward movement, provided support at $0.00001600 remains intact. A breakout above $0.00002490 would confirm a stronger bullish trend.

LBLOCK/USD – Four-Hour Chart
LBLOCKUSD shows a bullish divergence on the RSI around $0.00001420, signaling a potential reversal. The price has reclaimed $0.00001600 support and is now testing $0.00001880 resistance.
The 9-day SMA at $0.00001750 supports short-term upward momentum. A breakout above $0.00001880 could push the price toward $0.00002490.
Lucky Block (LBLOCK) Current Statistics
The current price: $0.00001650
Market Capitalization: $1,290,000
Trading Volume: $6,830
Do you need a coin that will 100X soon? Get LBLOCK here