Lucky Block (LBLOCK/USD) Market Shows Strong Bullish Signals For Upward Breakout
Estimated Reading Time: 3 minutes
Don’t invest unless you’re prepared to lose all the money you invest. This is a high-risk investment and you are unlikely to be protected if something goes wrong. Take 2 minutes to learn more

Lucky Block Price Forecast – November 25
The LBLOCK/USD market shows strong bullish signals for an upward breakout. The price just experienced a sell-side liquidity grab below the $0.00001540 swing low.
The indicators on the LBLOCKUSD chart suggest a bullish trend. The Stochastic Oscillator is oversold, with a value of 14.57, indicating that selling pressure is weakening and a potential reversal is imminent. The price is also attempting to climb above the 9-day Simple Moving Average (SMA), which, if sustained, could signal renewed buying momentum. This setup shows that buyers might soon dominate the market.
LBLOCK/USD Market Key Levels:
Resistance levels: $0.00002490, $0.00002990, $0.00003500
Support levels: $0.00001880, $0.00001600, $0.00001000
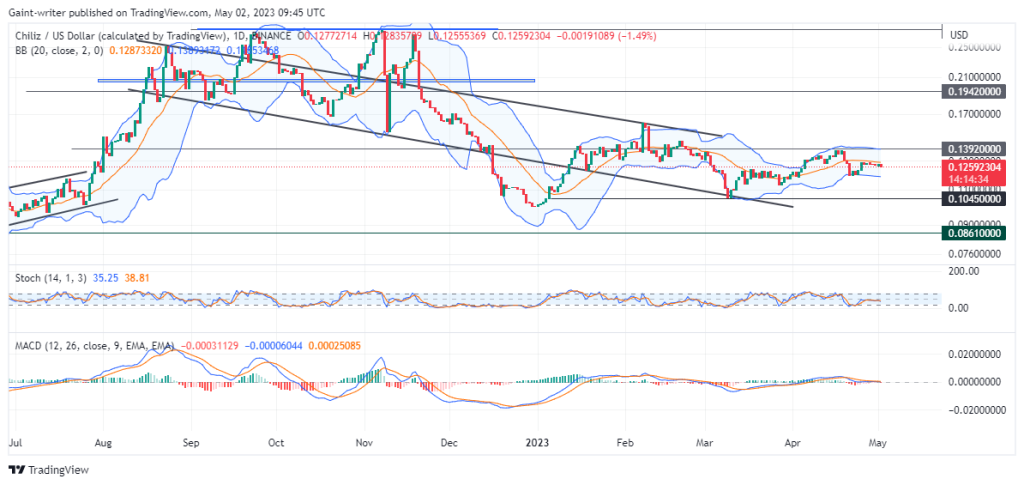
LBLOCK/USD – Daily Chart
The daily chart for LBLOCK/USD shows that the market is already in the discount zone as reversal looms.
The price action reveals that LBLOCKUSD has recently tested a support level at $0.00001540, with a bullish reaction evident by the green arrow. This rejection at support aligns with previous consolidation zones around $0.00001600. Additionally, the market appears to be heading to break out of a descending trendline.

What is expected of LBLOCK/USD in the coming days?
If the bullish momentum continues, LBLOCKUSD is projected to climb toward $0.00002990, its next major resistance. A breakout above this level could see the price targeting $0.00003500. This bullish outlook depends on maintaining support at $0.00001540, which would confirm the buyers’ strength in driving the price higher.

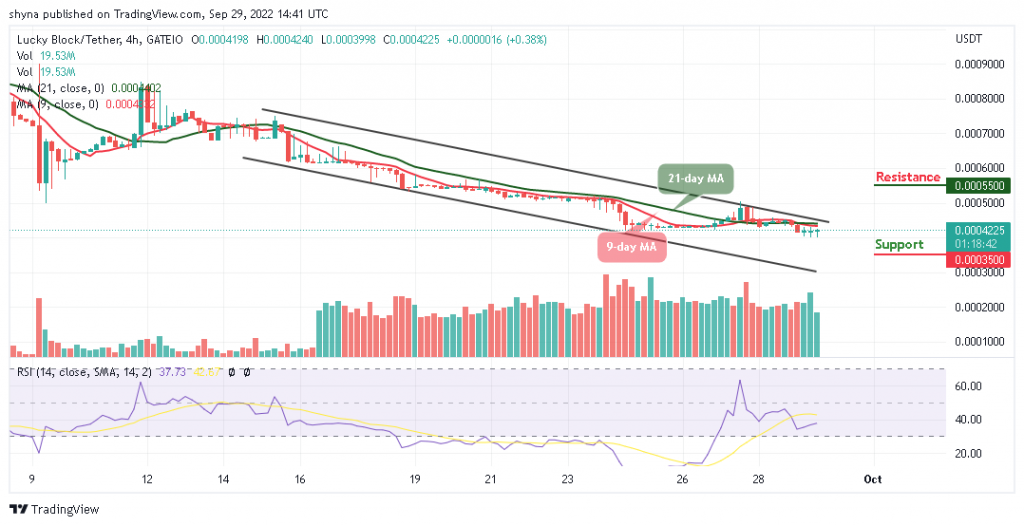
LBLOCK/USD – Four-Hour Chart
LBLOCKUSD is currently rebounding from the support at $0.00001540, marked by a bullish reaction. The Stochastic Oscillator shows an oversold condition, with momentum likely shifting toward buyers.
Price is consolidating near the 9-day SMA at $0.00001670 and approaching the descending resistance line. A breakout above $0.00001990 could confirm bullish momentum toward the next resistance at $0.00002490.
Lucky Block (LBLOCK) Current Statistics
The current price: $0.00001550
Market Capitalization: $1,220,000
Trading Volume: $8,720
Do you need a coin that will 100X soon? Get LBLOCK here