Wall Street Memes (WSM) Trade Heats Up, Eyeing a Bounce
Estimated Reading Time: 4 minutes
Don’t invest unless you’re prepared to lose all the money you invest. This is a high-risk investment and you are unlikely to be protected if something goes wrong. Take 2 minutes to learn more
Wall Street Memes Price Prediction – November 9
Wall Street Memes (WSM) shows signs of renewed bullish sentiment as trading volumes increase. Indicators hint at consolidation giving way to an upward breakout, suggesting that buyers are regaining control and positioning the market for a potential rebound.
Wall Street Memes market is exhibiting signs of mounting bullish momentum as trading activity intensifies across short-term frames. Technical indicators reveal that the token is stabilizing above key support zones, hinting at renewed buyer confidence. With momentum oscillators turning positive, the market appears poised for a potential rebound, reinforcing expectations of a sustained upward move.
WSM/USD Market
Key Levels
Resistance levels: $0.0006, $0.0007, $0.0008
Support levels: $0.00035, $0.0003, $0.00025
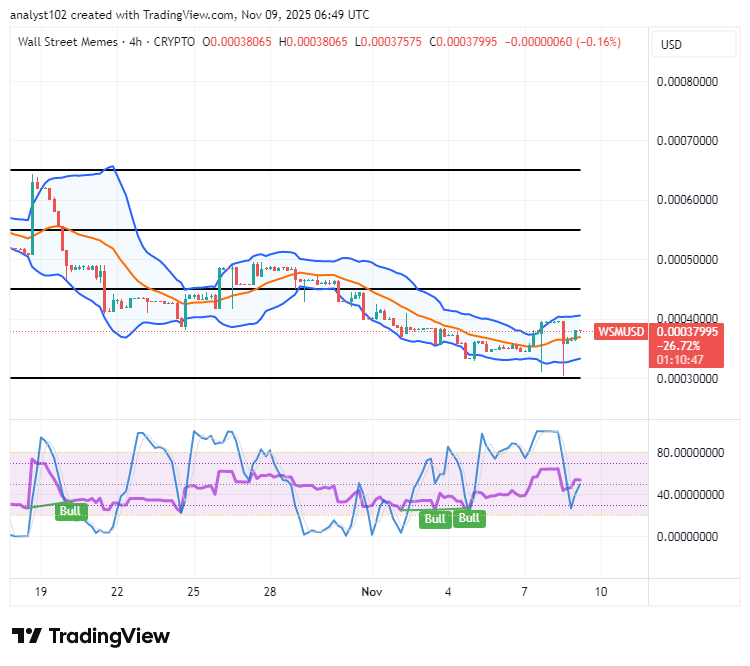
WSM/USD – 4-hour Chart
The WSM/USD medium-term chart showcases the crypto market deals heating up, eyeing a bounce in the setup.
The Stochastic Oscillators are systemically repositioning on a bullish threshold, signaling renewed market optimism and increasing buyer dominance across short-term trading zones. The trend lines of the Bollinger Bands are tactically getting repositioned toward the upside, reflecting growing volatility and a potential breakout formation that could strengthen bullish continuation momentum.
Will Wall Street Memes (WSM) Sustain Its Upward Momentum and Confirm a Decisive Bullish Rebound?
Wall Street Memes (WSM) appears positioned to sustain its upward momentum, as technical indicators align in favor of buyers. A confirmed rebound above near-term resistance could strengthen bullish conviction, signaling the potential for an extended upward continuation phase.
Wall Street Memes (WSM) continues to demonstrate encouraging signs of bullish extension, supported by rising volume and improving market sentiment. The current consolidation phase near resistance levels suggests accumulating strength. Should the price sustain above these zones, technical indicators project an expanded recovery, potentially ushering in a stronger continuation of the upward trend in the near term.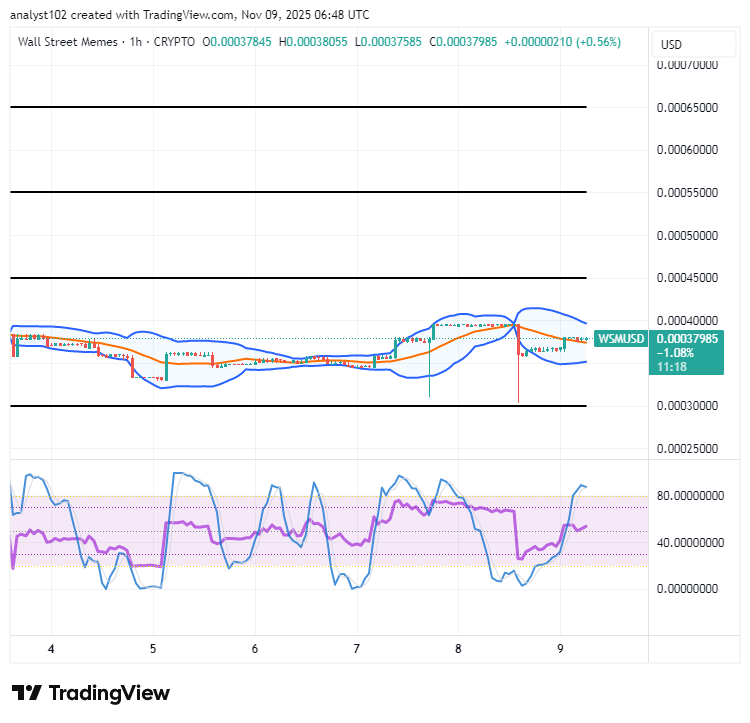
WSM/USD 1-hour chart
The WSM/USD short-term chart reveals increased activity in the base crypto market, suggesting a likely upward bounce.
The Stochastic Oscillators are in a mood of signaling that buyers are slowly and steadily regaining energy and preparing to reassert control, supporting the potential continuation of the prevailing bullish trend. The Bollinger Bands have positioned northward, aligning with successive rises and indicating strengthening upward momentum across the chart, suggesting that market volatility is expanding in favor of buyers as price action continues testing higher resistance levels.
BIGTIMEUSDT and WSMUSDT contracts are now live on Bybit!
Unlock fresh trading opportunities with up to 25x leverage—now available on Bybit Futures Grid Bot too!
Take your strategy to the next level. Start trading today:
BIGTIME: [https://i.bybit.com/20rabgrK](https://i.bybit.com/20rabgrK)
WSM: [https://i.bybit.com/ab1F9gWH](https://i.bybit.com/ab1F9gWH)
#Bybit #CryptoTrading #Futures #BIGTIME #WSM
🚀 BIGTIMEUSDT & WSMUSDT Contracts now on Bybit!
— Bybit (@Bybit_Official) October 12, 2023
Dive into new trading opportunities with 1-25x leverage. Plus, they’re now on Bybit Futures Grid Bot! Start trading now.
📈 BIGTIME: https://t.co/FAQlbhnzAh
📈 WSM: https://t.co/pb2y2AfMBE#CryptoTrading #Bybit
Buy and stake WSM now! https://wallstmemes.com/