Wall Street Memes (WSM) Market Calms, Spike Ahead
Estimated Reading Time: 3 minutes
Don’t invest unless you’re prepared to lose all the money you invest. This is a high-risk investment and you are unlikely to be protected if something goes wrong. Take 2 minutes to learn more
Wall Street Memes Price Prediction – November 6
After a short pullback, Wall Street Memes (WSM) became less volatile as traders took profits near recent peaks. Consolidation around key support indicated calmer market behavior, suggesting accumulation may be underway before a potential bullish spike ahead.
The Wall Street Memes (WSM) price began consolidating around a notable support zone, signaling stability and possible accumulation. Such behavior often hints that traders are positioning early for a potential bullish spike or renewed upward momentum soon.
WSM/USD Market
Key Levels
Resistance levels: $0.0006, $0.0007, $0.0008
Support levels: $0.00035, $0.0003, $0.00025
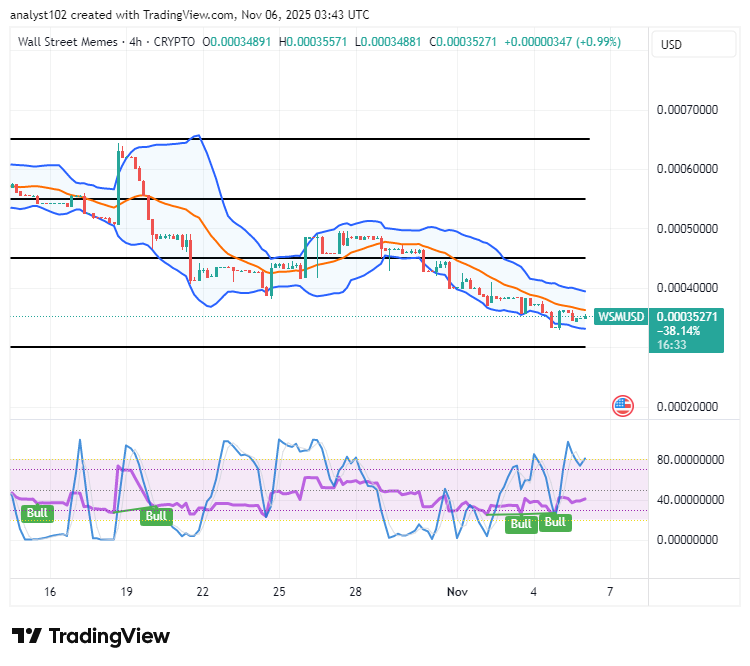
WSM/USD – 4-hour Chart
The WSM/USD medium-term chart showcases that the crypto-economic business operation is calming down, as spikes lie ahead.
The Stochastic Oscillators are now turning upward, signaling a strengthening bullish outlook. Meanwhile, the Bollinger Bands are trending slightly downward, forming a bullish-flag setup that signals possible upward movement ahead. This pattern may draw renewed investor interest and spark short-term buying activity as traders anticipate a breakout and stronger recovery in price momentum.
Can Wall Street Memes (WSM) Sustain Its Calm Phase Before a Potential Bullish Spike Ahead?
Wall Street Memes (WSM) shows promising potential for long-term investors. The current consolidation phase reflects growing market stability, while bullish indicators suggest renewed momentum could emerge.
Sustained community engagement, expanding exchange listings, and improving technical setups have continued to shape the WSM/USD market positively. Trading volumes have shown steady growth as confidence builds among participants, while periodic price consolidations near key supports signal healthy market corrections. 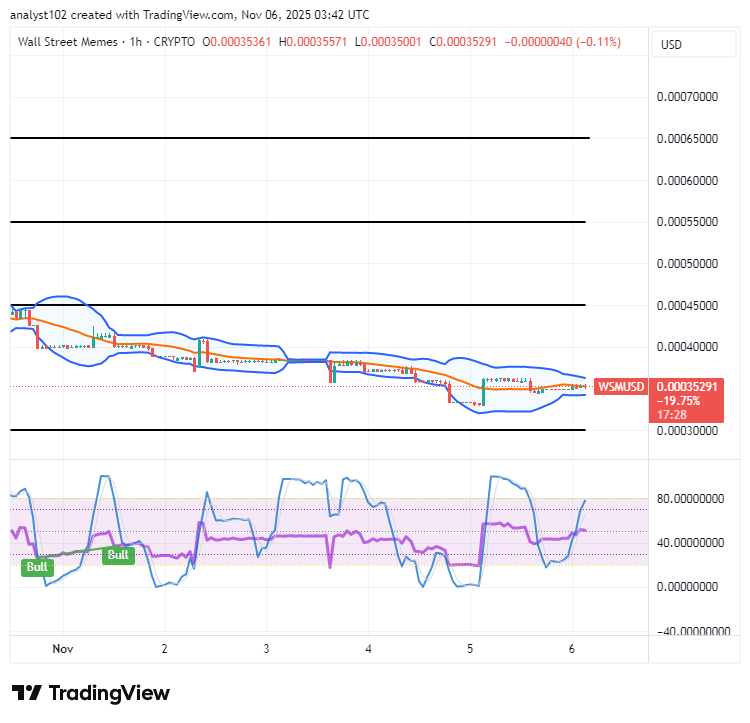
WSM/USD 1-hour chart
The WSM/USD short-term chart shows that the crypto-economic market is stabilizing, suggesting a brief pause before potential upward spikes ahead.
The Stochastic Oscillators have resorted to a northbound-swerving style, denoting that moves to the upside are gradually featuring. The Bollinger Bands are trending downward, signaling potential recovery opportunities from lower levels as volatility cools. This setup suggests the market may be gearing up for an upward move that could attract renewed bullish participation and enhance overall price resilience in the near term.
4 DAYS TO GO UNTIL A MASSIVE $1M OF BUYBACKS IS COMPLETED, SPARKING HUGE MARKET EXCITEMENT AHEAD!
4 DAYS TO GO UNTIL A MASSIVE $1M OF BUYBACKS IS COMPLETED! 🔥
— Wall Street Memes (@wallstmemes) October 7, 2023
🚀 $WSM 🚀
Buy Now ➡️ https://t.co/ffr2clEknx pic.twitter.com/pOrhialttd