BNB (BNB/USDT) Seeks Support Near $645.89 After Facing Rejection at $660 Levels.
Estimated Reading Time: 3 minutes
Don’t invest unless you’re prepared to lose all the money you invest. This is a high-risk investment and you are unlikely to be protected if something goes wrong. Take 2 minutes to learn more
BNB Long-term Analysis: Bullish
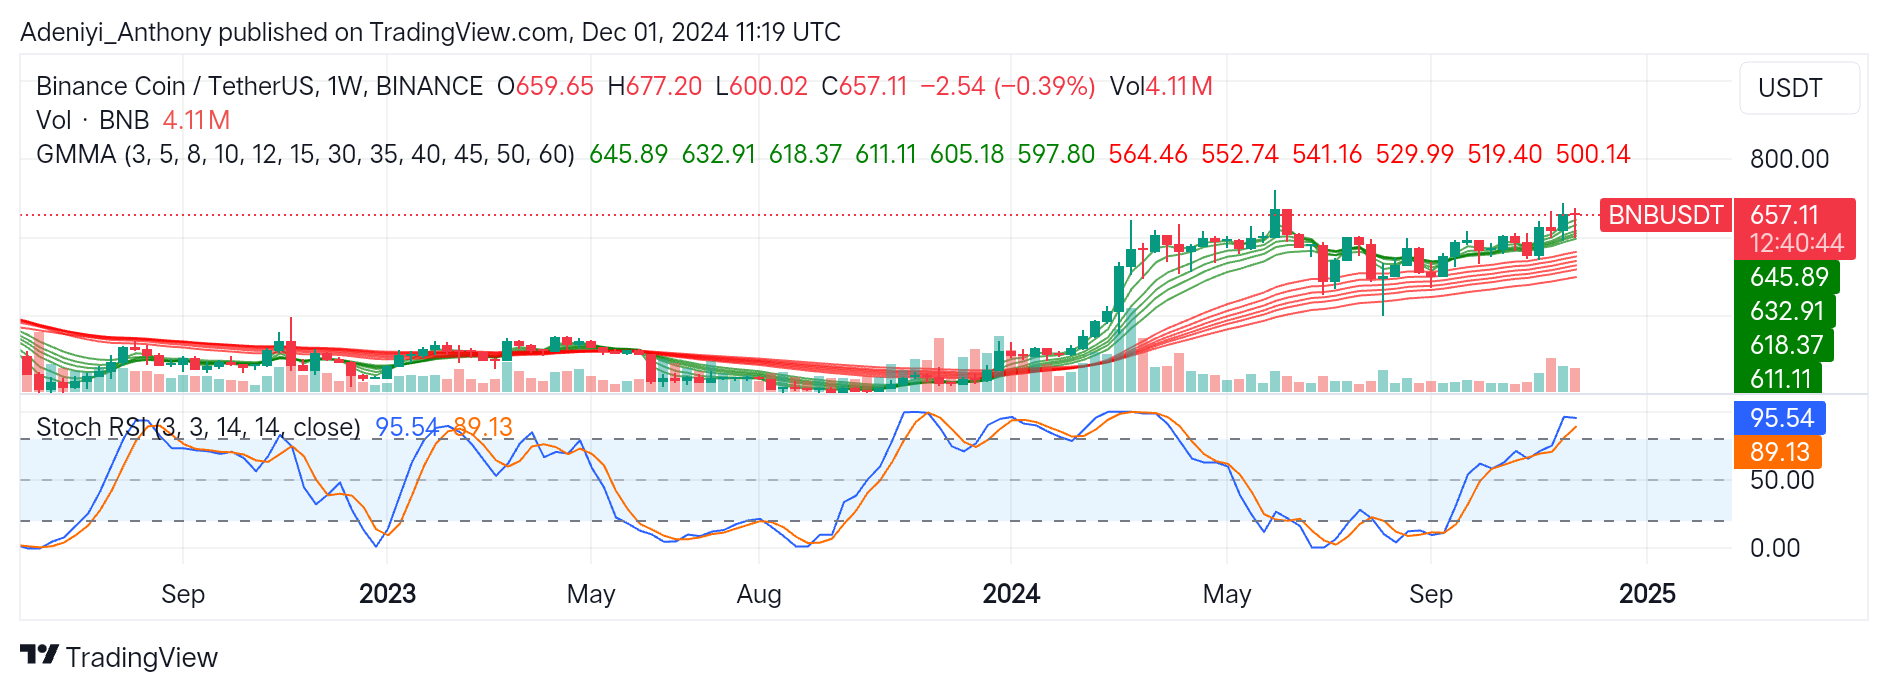
BNB Against the Tether on a weekly timeframe has been trending upward, as seen in the steady price movement above the Guppy Multiple Moving Averages (GMMAs). However, despite this bullishness, the pair seems to be retracing to the closest support level at $645.89.
The recent price actions of the pair show that a bearish candlestick is forming at the top of the bullish trend. This suggests the current bullish pressure may be waning, as depicted in the cautionary picture displayed by the Stochastic RSI.
Currently, BNB/USDT operates at $657.11 with a slight decline of 0.39%
Technical Indicator
Major Resistance Levels: $677.20, $700.00, and $730.00
Major Support Levels: $645.89, $618.37, and $564.46
BNB Technical Analysis
The analysis of BNB against Tether on a weekly timeframe shows that the pair remains in a strong uptrend as confirmed by the GMMA and the formation of higher highs.
However, the 4.11 million traded volumes suggest a slight tapering off compared to previous weeks, which indicates reduced momentum in the short term.
On the other hand, the Stochastic RSI signals the pair operates in an overbought zone, with the lines reading 95.54 and 89.13 for %k and %D, respectively. This signals a short-term pullback might occur before another uptrend.
To this end, a bullish breakout with a supported volume above $677.20 could pave the way for a rally toward $700.00. Conversely, a dip below $645.89 would signal a pullback with $618.37 as the potential re-entry point.
BNB/USDT Analysis: What’s Next?
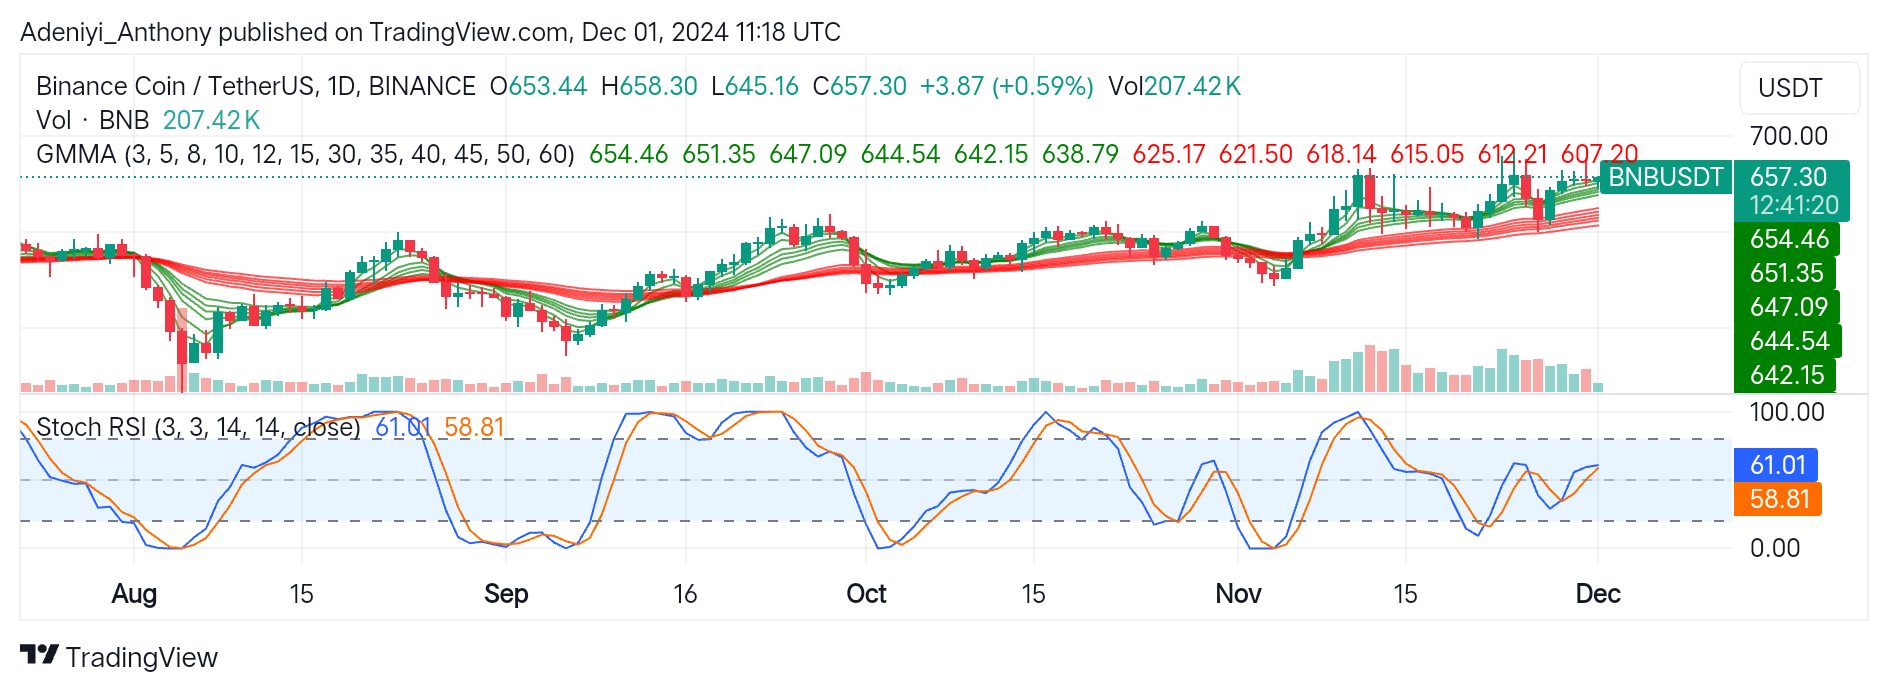
The daily analysis of BNB against the USDT shows that the pair is bullish. A recent candlestick suggests that the price seems to be testing the resistance of $657.00. However, if bullish momentum persists, breaking the $657 could push the price towards $680.00.
On the other hand, the Stochastic RSI suggests the pair has plenty of room for improvement to North with the lines reading 61.01 and 58.81. However, the convergence of the lines signals an impending bearish crossover. Therefore, a dip toward the 50-mark level will confirm a bearish movement.
Therefore, traders can monitor the $654.46 and $647.09 levels, as these points will determine the next direction.
You can purchase crypto coins here. Buy LBlock